100 Metros: A Closer Look (pt. 2)
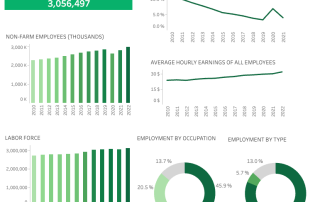
A closer look at the recently-updated 100 Metros Dashboard, focusing on key employment metrics.

A closer look at the recently-updated 100 Metros Dashboard, focusing on key employment metrics.
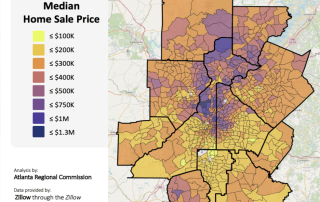
A look at spatial and trend patterns in updated Zillow home price data for 2021
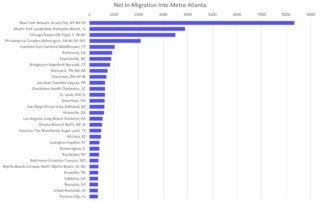
Population migration to and from Atlanta: which metros are the "givers" and "takers" ?
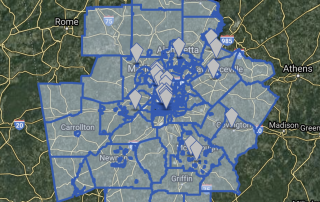
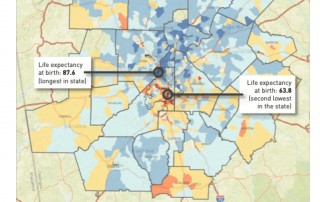
Where do the school-aged kids without internet access (or a computer) live in our Atlanta Region?. And are there correlations of higher poverty with the home locations of school-aged kids without access?
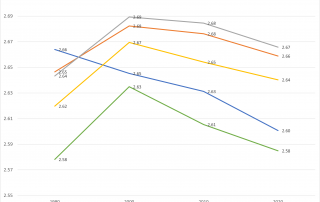
Population growth is declining recently, but what's happening to household size? Well, a little bit of everything, depending on where you look
In the last decade, multifamily housing has driven a significant share of the population growth in core areas of our region. Multifamily activity has slowed in recent years, and even in the heyday years of Atlanta multifamily construction, building in the sector was relatively constrained compared to single-family in Atlanta and to multifamily building in other metros.
Population is still growing at a healthy clip in our area, but this growth was ebbing some even prior to the pandemic. We look at some ESRI data that indicates that, while fewer small areas are losing population 2010-2020 as compared to the last decade, fewer tracts are growing as quickly as they did during the 2000-2010 period. And overall, our region's growth rate has slowed 2010-2020.
This month's regional snapshot provides a detailed overview of senior demographics (historic trends and likely future), andl presents the latest data on pandemic-related and other public health challenges. for these age groups.
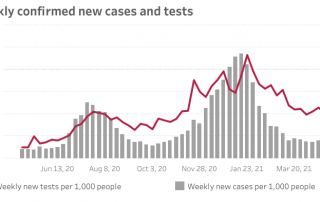
A status update on cases, tests, hospitalizations and deaths in the 10-county area.
A look at non-pandemic differences in men's and women's labor force participation by age grouping, with a look at long-term career and earnings implications.