Multifamily was one of the hot property types in Atlanta coming out of the recession into the relative prosperity of the 2014 to 2019 period. Historically high amounts of multifamily development was a prime mover of the City of Atlanta’s record population increases in the last half of the 2010s. Other nodes of multifamily growth have been along the interstates in our region, largely to the portion of the region north of I-20.
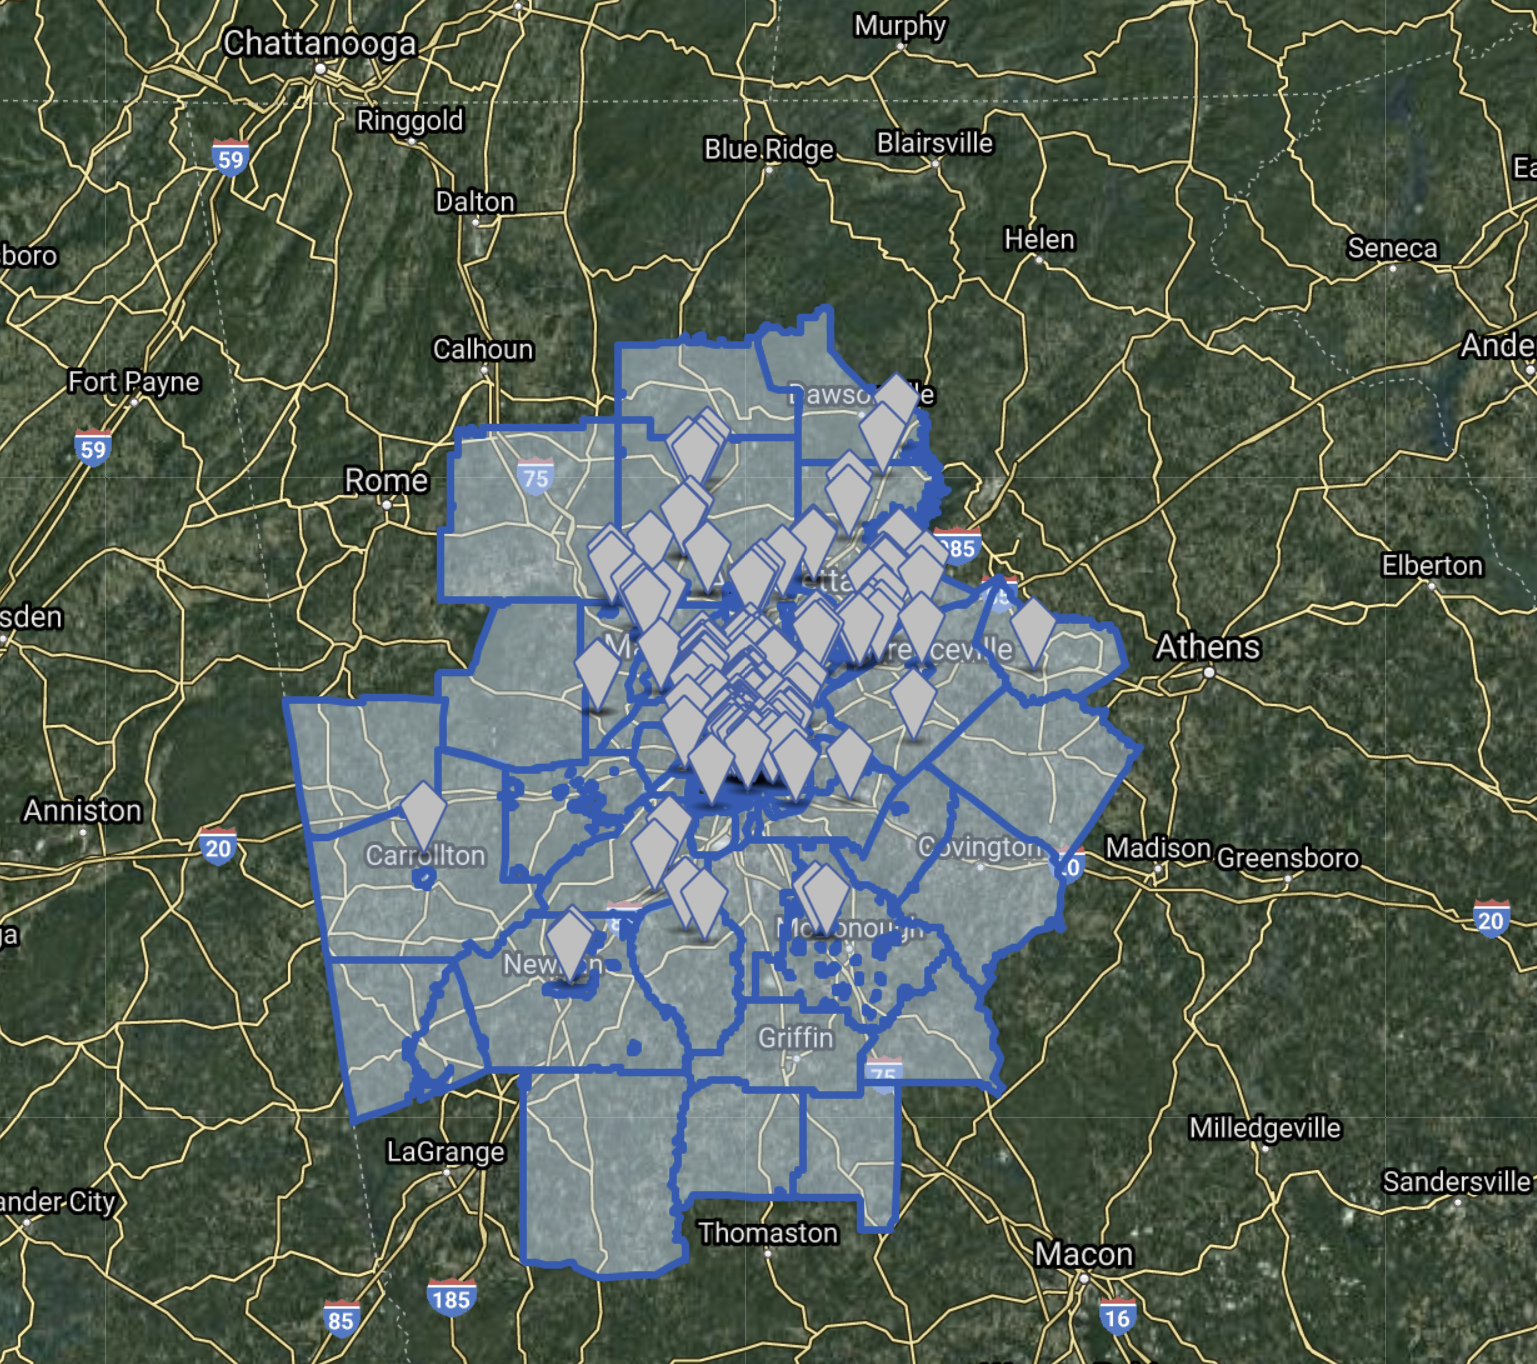
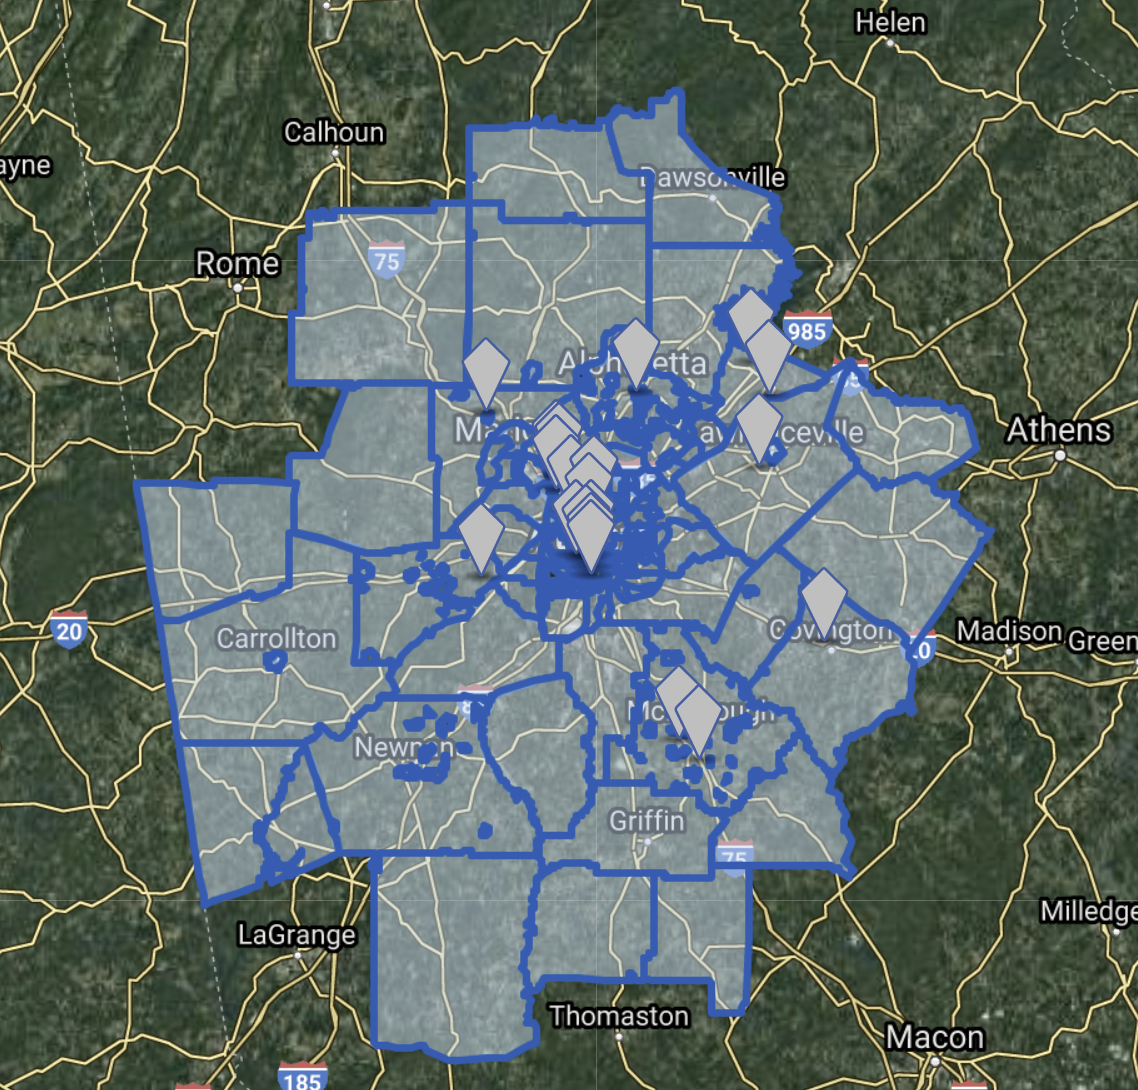
Let’s look at the very recent past to start assessing the current state of the multifamily market. Map 1, sourced from CoStar, Inc, shows below the dispersion of the nearly 44,000 units in 211 projects finished between 2018 and the present. Map 2 displays project locations under construction or proposed as of June 2021: 6,814 units in 38 projects. We see a slowing with a greater clustering to the northeast and an overall northern slant still largely evident (excepting Henry County activity). Other CoStar data on the price of the new units combines with the spatial trends to bolster concerns about rental affordability. The median monthly rent for all metro-wide units coming on line between 2018 and 2021 was about $2,000, which is more than half of the metro median monthly household income for renters ($3,900 in the 2019 American Community Survey 1-year).
Map 1: Multifamily Projects with Year Built 2018-2021 (Source: CoStar)

Map 2: Multifamily Projects Under Construction or Proposed as of June, 2021 (Source: CoStar)

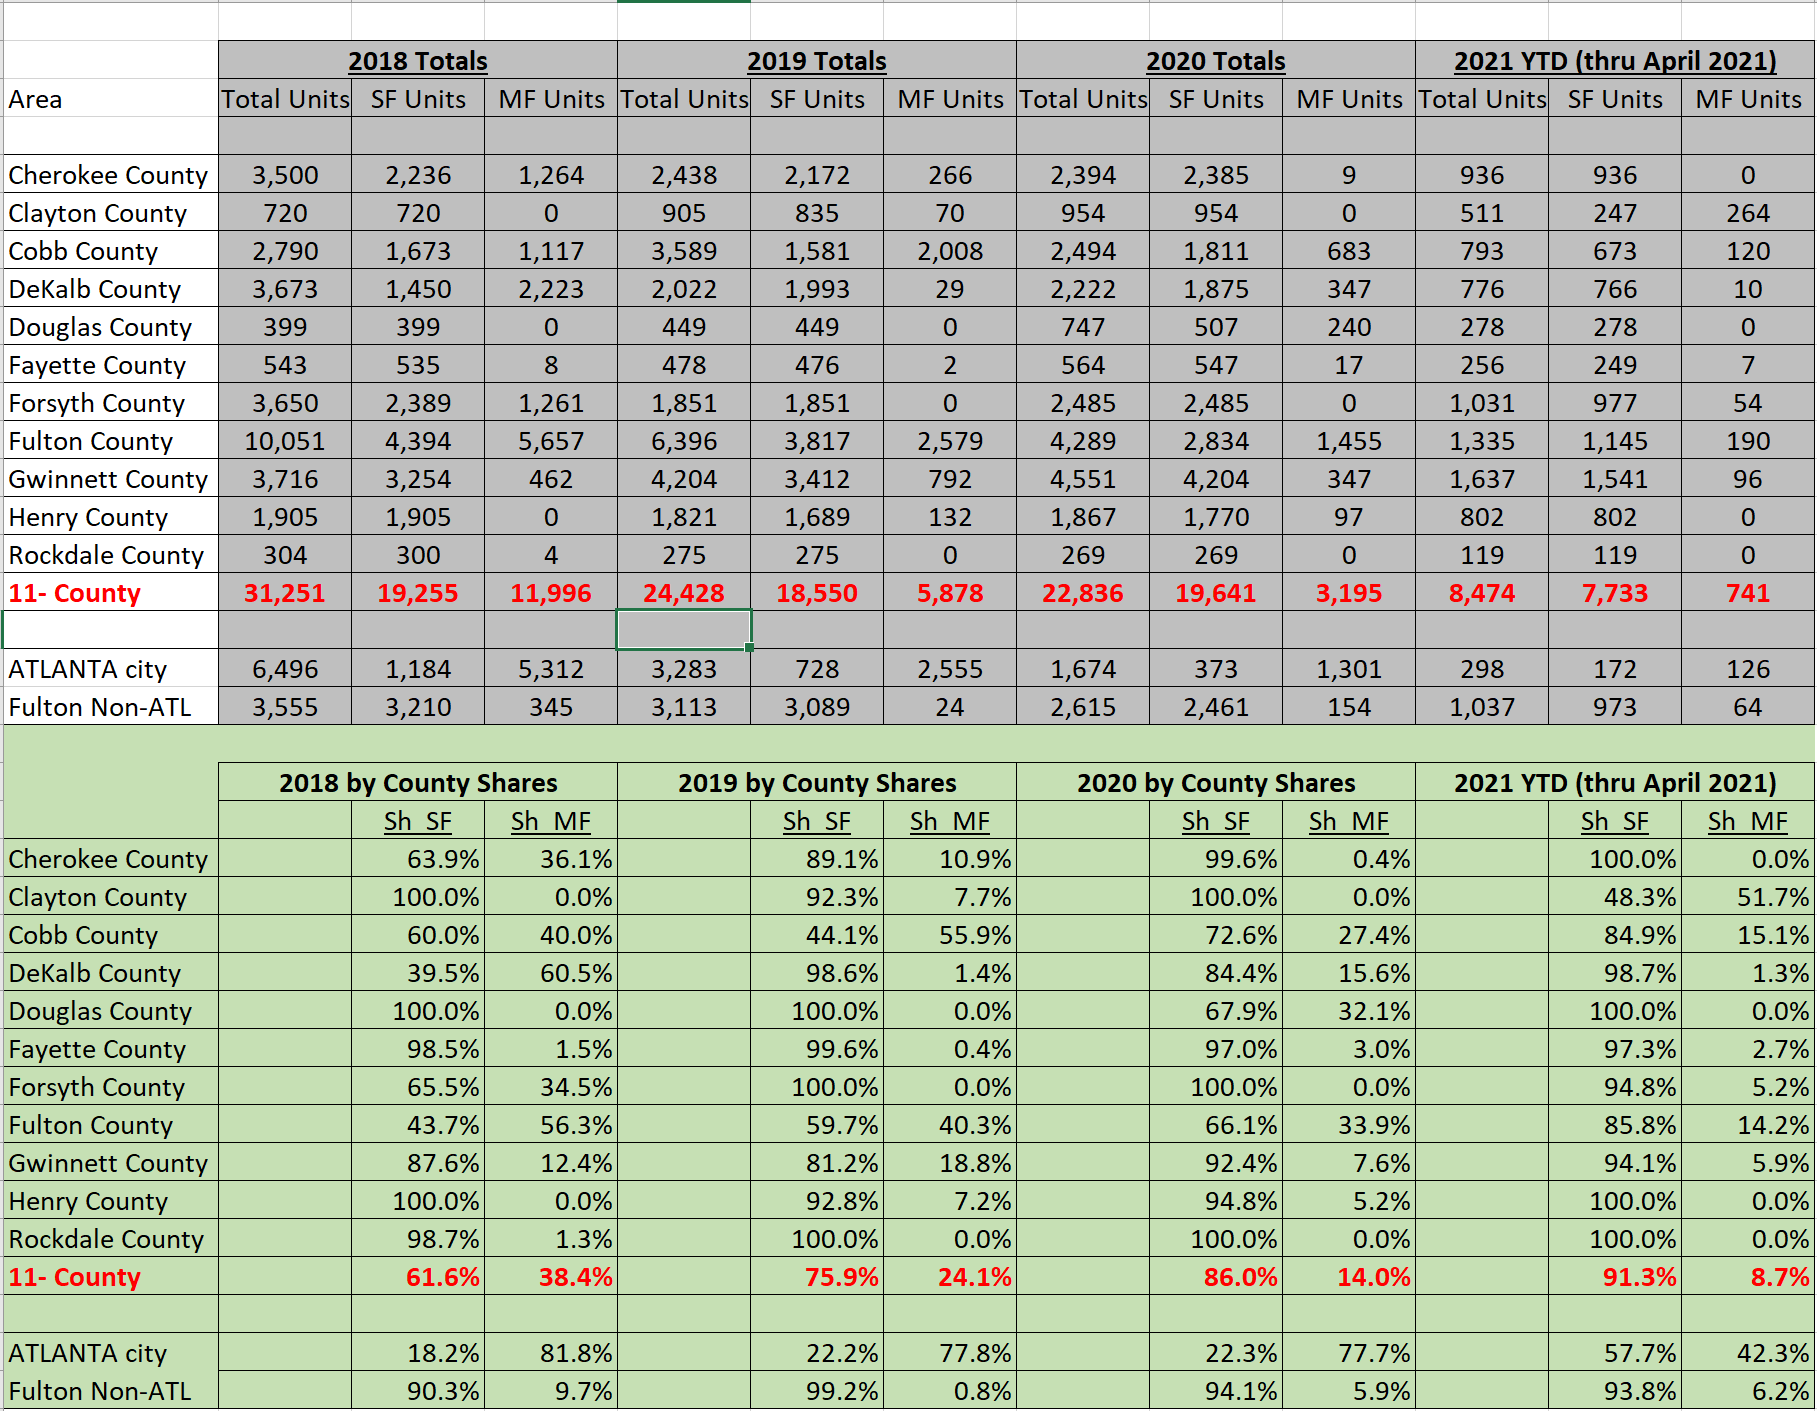
County summary permits trends by type (Chart 1 below) provide further aggregated evidence of the slowing. Multifamily’s share of all permitted units has dropped from over 1 in 3 in 2018 (38% of the total) to under 1 in 10 for the year to date 2021. The 3,000 multifamily units permitted across the 11-county area for the calendar year 2020 were only 25% of the 12,000 units of 2018, and also were half the number permitted as the market began to slow in 2019. Correspondingly, single-family units slowed much more slowly than did multifamily 2018-2021, and their numbers even increased from 2019 to 2010.
At the jurisdictional level, only Clayton County shows a higher share of multifamily units in 2021 than in 2018, and this is simply the result from no units being built in the first three years of the period. The relative multifamily decline is greatest in the City of Atlanta, where 81 percent of the permitted units in 2018 were multifamily, yet the share has fallen to 42% in 2021 Year to Date.
Chart 1: Units Permitted by Type for ARC Region and Counties 2018-2021 (Source: SOCDS; ARC Research & Analytics)

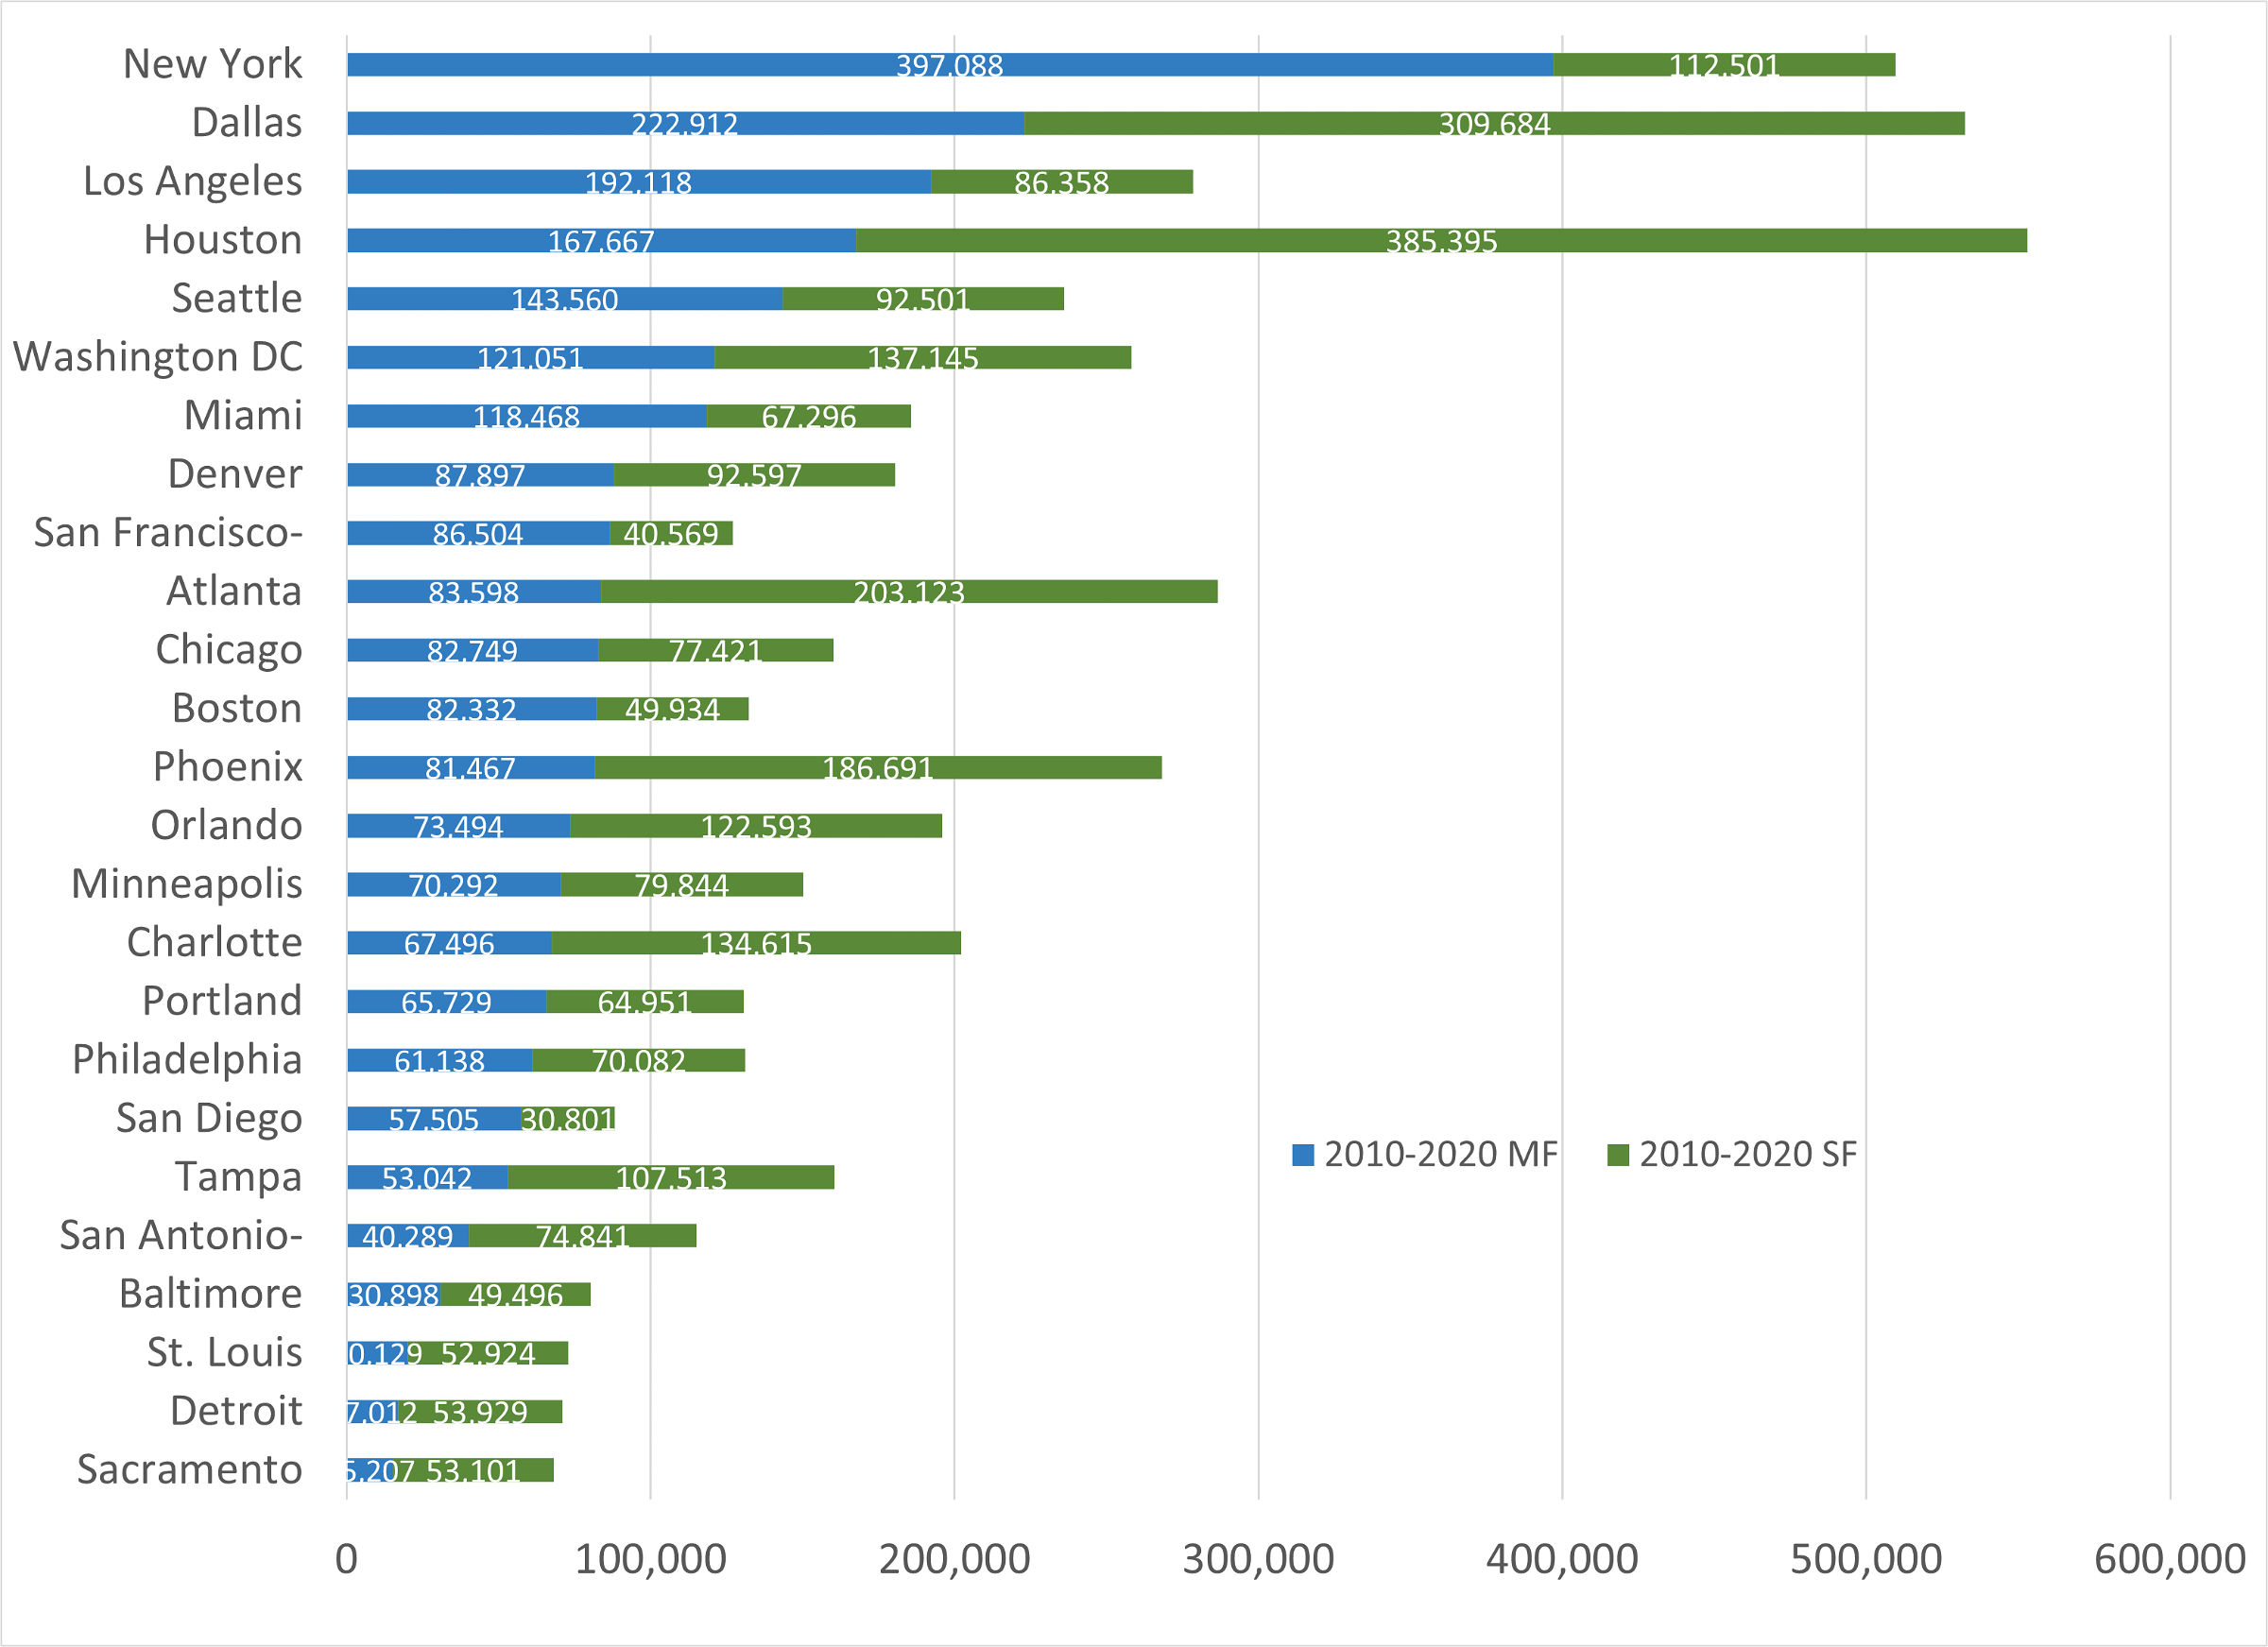
And finally, comparing Atlanta multifamily building over the span of the last decade to levels of other metros provides a worthy caveat: Atlanta’s multifamily growth did not stand out on the national stage at any point in the last decade. In Chart 2, you can take a look at Atlanta in the context of the other 24 largest metros in the country (as determined by 2019 ACS). We rank 10th in the number of multifamily units permitted, but that compares to a rank of 4th highest in overall activity and to 3rd most in single-family activity. Atlanta’s 286K permits 2010-2020 trails Houston and Dallas (both with nearly double Atlanta’s single-family activity) and New York (which led the way in multifamily permitting).
Chart 2: Units Permitted by Type for 25 Largest Metros 2010-2020 (Source: SOCDS; ARC Research & Analytics)


