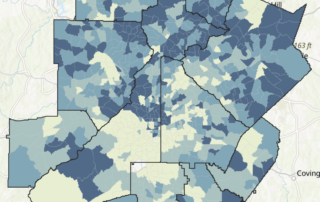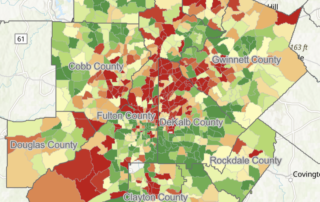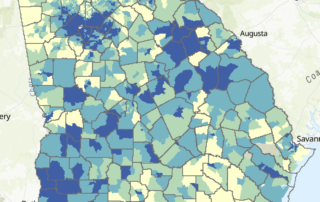
Georgia’s Non-Hispanic Black Population, from 2010 to 2020
We're kicking off Black History Month with an updated look at the state's Black population at the Census tract level, as well as examining change since 2010.

We're kicking off Black History Month with an updated look at the state's Black population at the Census tract level, as well as examining change since 2010.
With schools considering a return to remote learning to prevent omicron surges among students and faculties, it's again worth a look at which communities are best positioned to handle quick switches and where we see the largest shares of school-age children.
A very scientific approach to estimating Old Saint Nick's stress levels as he traverses the 11 county area.
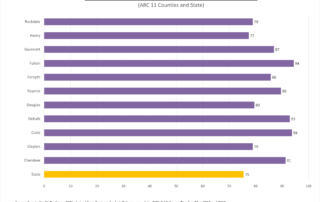
With the holiday indulgence season here, we're offering a look at how our counties measure up on healthy behaviors year-round.
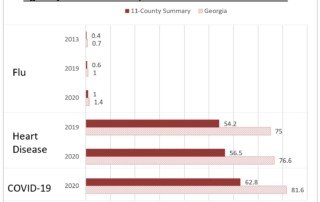
A high-level overview of the public health issues facing Metro Atlanta, including COVID-19, homicide, opioids and infant mortality.
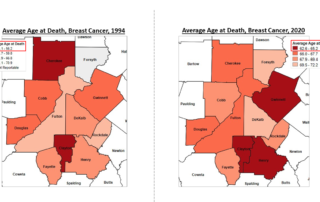
Finding reasons for optimism and what work the 11-county area still has ahead of it when it comes to battling breast cancer in the future.
A look at coming population growth in the metro area's Hispanic community.
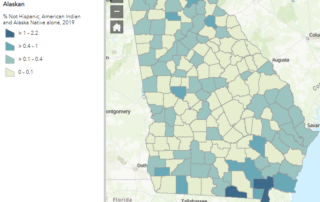
To celebrate Indigenous Peoples' Day, we created an interactive map showing shares of Native Americans living in counties across Georgia.
To what degree are Georgians employed in manufacturing? And in what areas is it the most dominant industry of employment? This post offers a quick glimpse into the state of manufacturing careers in Georgia.
Our 2021 celebration of Hispanic culture in the 11-county metro continues with a look at the country of origin for our Hispanic residents.