Finding the Cooling Gaps in a Hot City
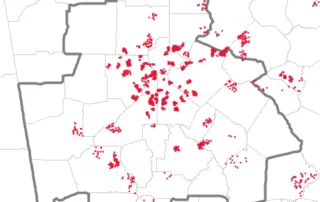
Extreme heat doesn't hit every neighborhood the same, and now we can map where vulnerability is highest.

Extreme heat doesn't hit every neighborhood the same, and now we can map where vulnerability is highest.
The World Cup is coming to Atlanta, and the battle for the home crowd has already begun. Dive into the numbers to see which international teams have an advantage hidden right in our neighborhoods.
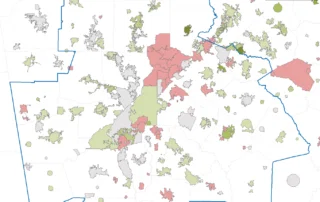
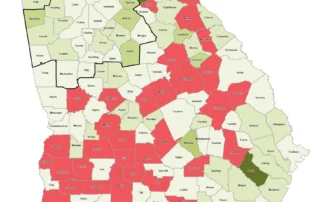
Think Atlanta's growth is confined to the suburbs? The latest Census estimates tell a very different (and far more interesting) story.
Population growth has slowed across the country, but not every city in the Atlanta region is following that script. See which places are booming, which are shrinking, and what the new map of metro growth really looks like.
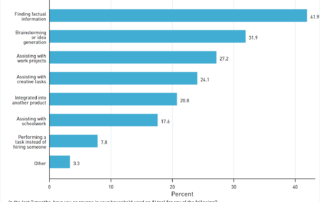
AI is spreading across the ATL, but enthusiasm isn't exactly peach-perfect.
Two-thirds of Atlanta households use AI. Here's what they're doing with it and how that compares to the rest of the country.
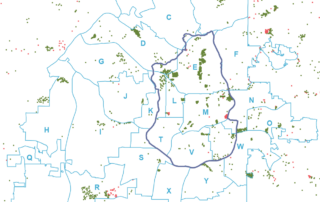
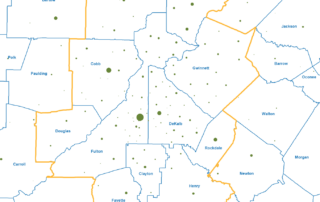
Public libraries aren't just buildings; they are important community assets. Explore how funding, location, and usage vary across the Atlanta region.
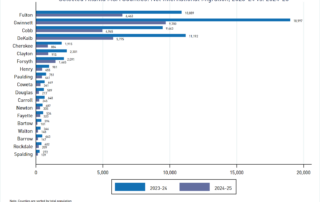
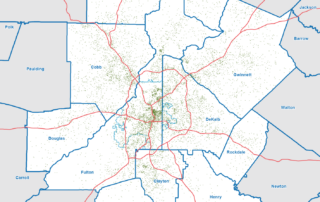
The forces reshaping metro Atlanta are hiding in the data. Explore the county level trends in domestic and international migration.
From outer ring counties to long-dominant core players, the Census Bureau's 2025 population estimates reveal regional development patterns worth a closer look.
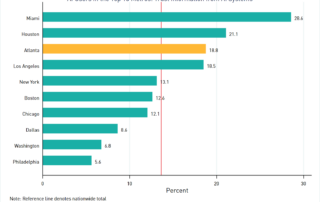
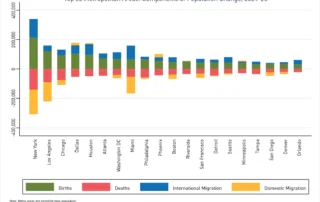
What's driving population change in major metros across the country? How does Atlanta stack up? A breakdown of the key components shows surprising winners, losers, and trends worth watching.