So the media has been flush recently with news about a slowing in our nation’s population increase compared to prior decades. Now, it is not as if the USA as a nation is not growing; we are just growing more slowly than we were. In late April, we looked at some results from apportionment data that show this trend quite clearly.
This post is the first of a two-part series previewing more localized data, by looking first at microtrends in private sector estimates, then macrotrends from public sector data. In Part I, we compare ESRI Business Analyst Online small-area estimates from the last decade to trends from 2000-2010.
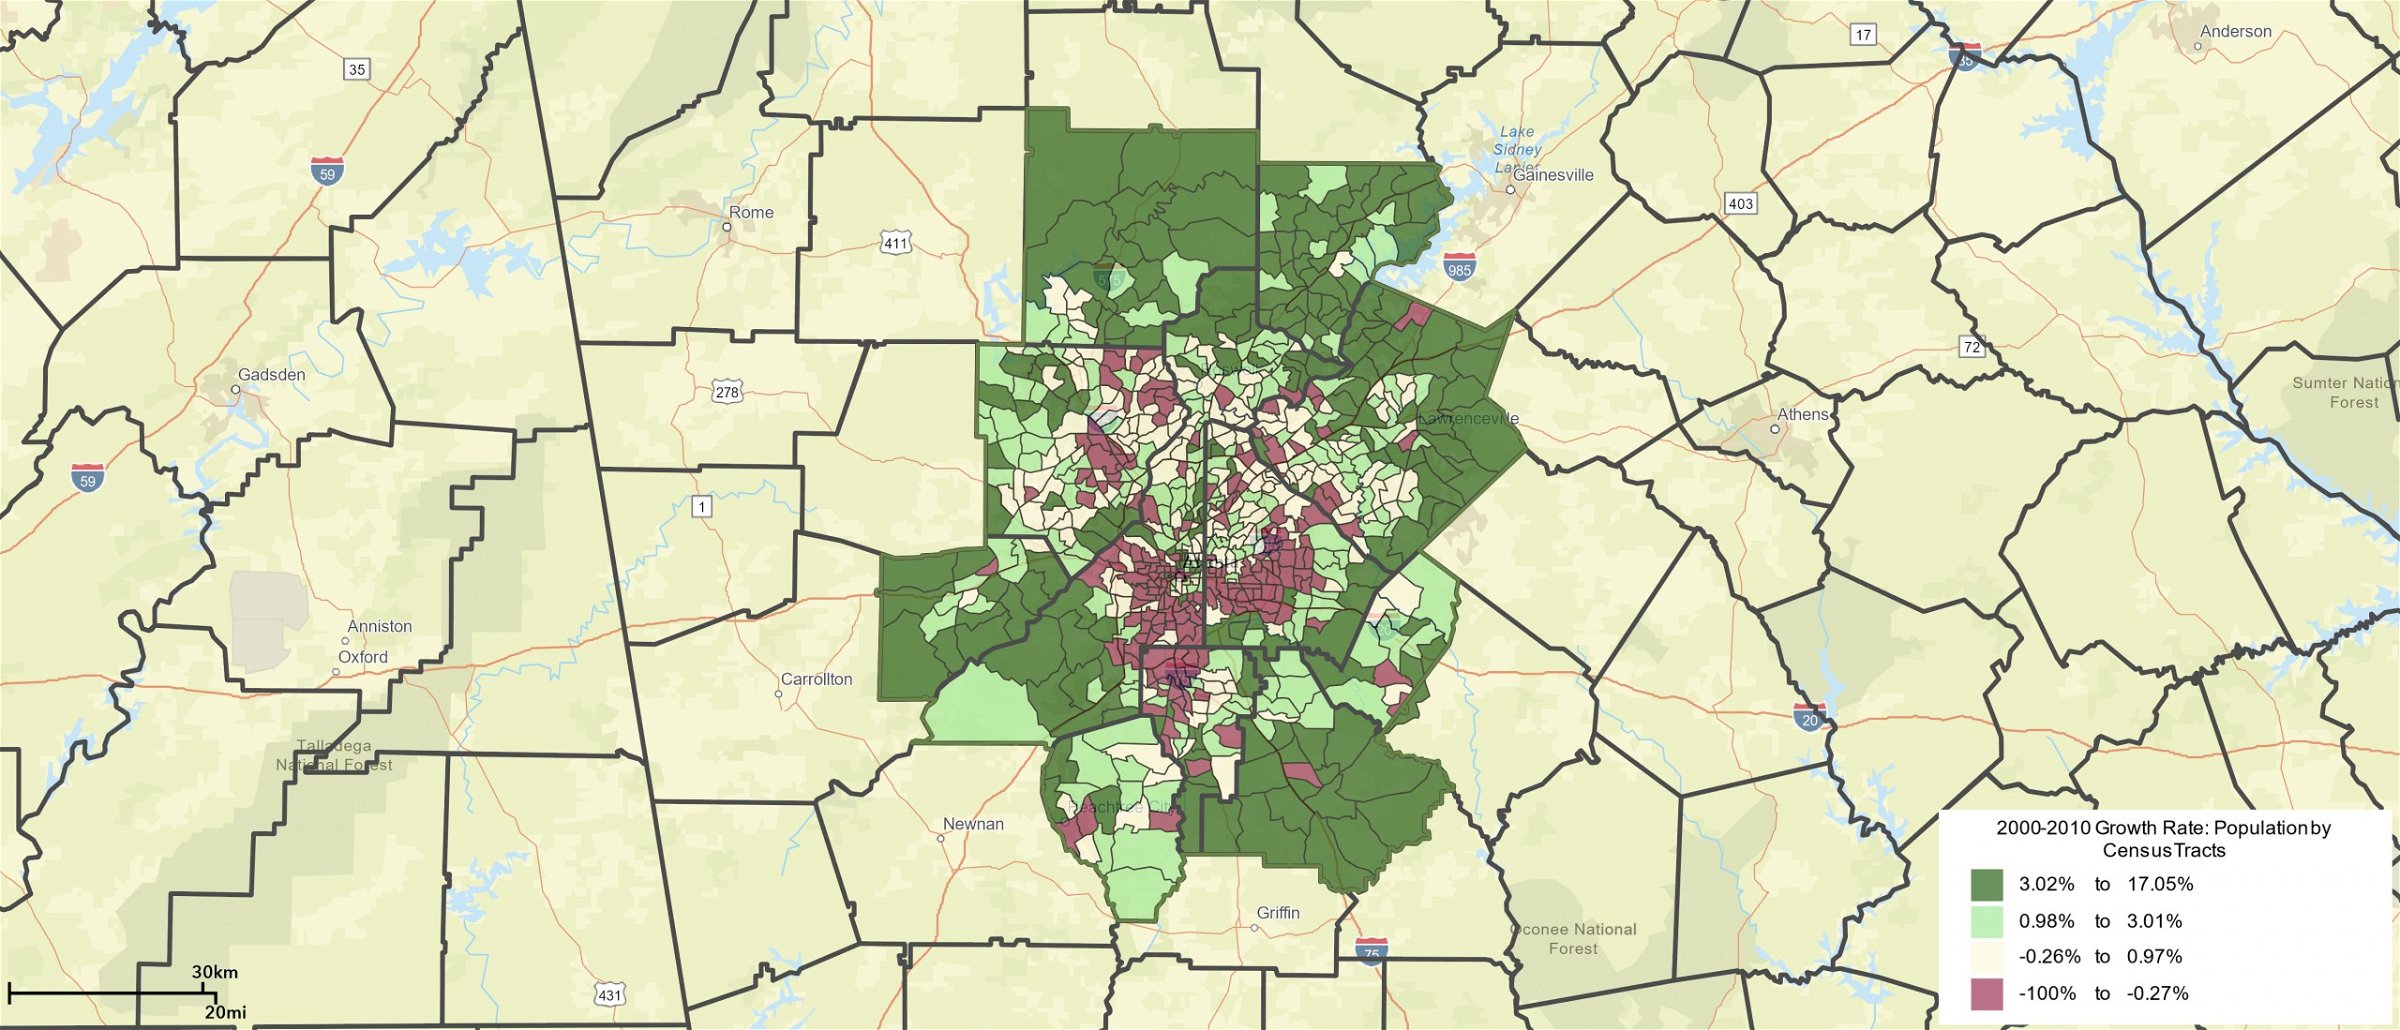
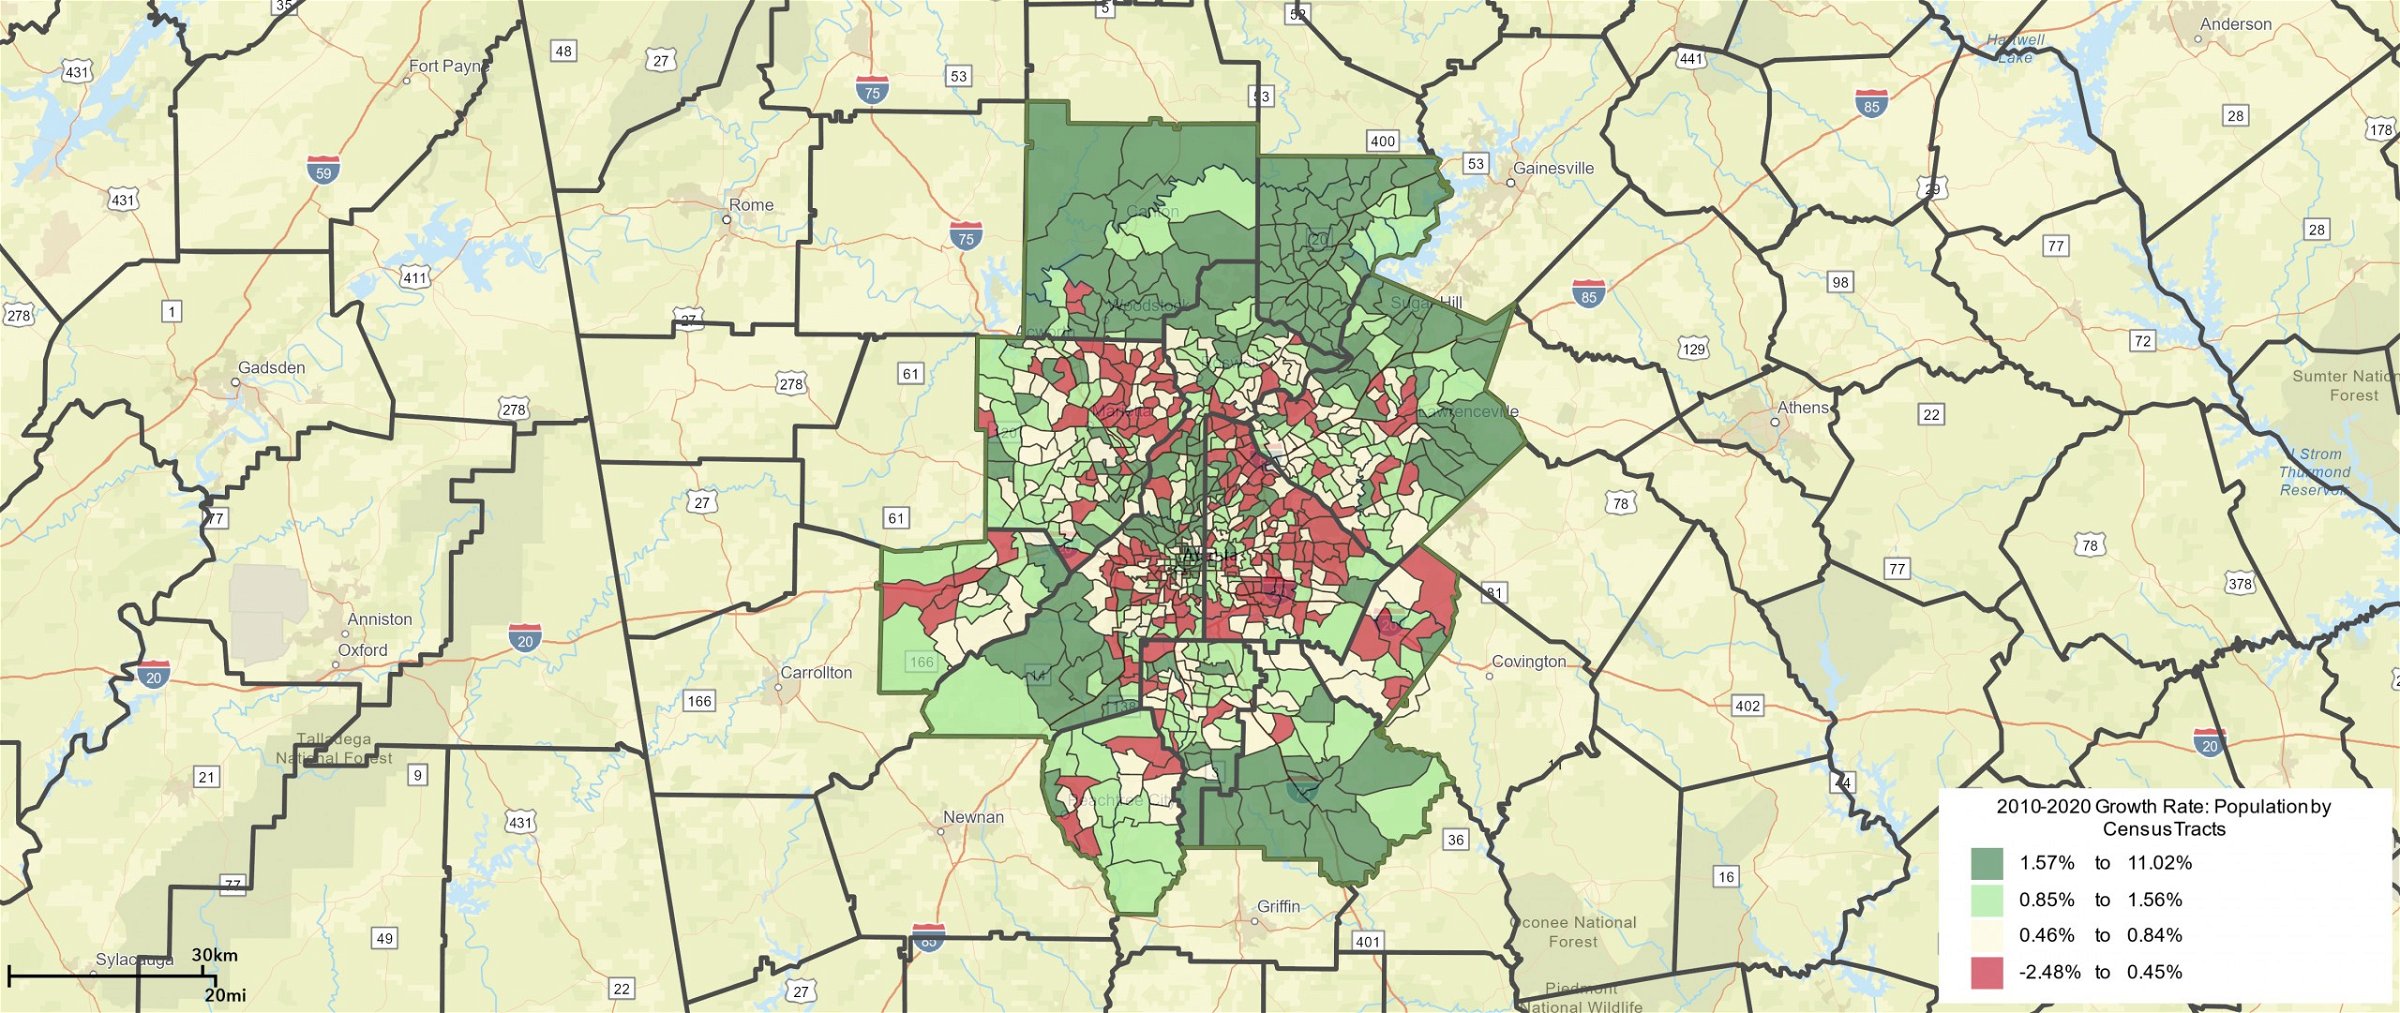
The first two maps below provide a requisite look at census tract population change: for Map 1, 2000-2010 change in 2010 geography, and for Map 2, 2010 to 2020. Note that these maps are by quartile of change (4 categories for each map). Red shading indicates the lowest 25% of tracts in terms of change. At a glance, it looks as if there are more tracts in Map 2 in the lower category than on Map 1. And that’s true in general – as we see below, there is less growth 2010-2020 than in 2000-2010. But notice (and this is a preview too of more discussion below) on Map 2, the lowest quartile range is not necessarily indicative of decline (population loss); the lowest quartile on Map 2 includes tracts that had very minor population increase as well as those that appear to have lost population 2010-2020.
Map 1: Trends in Census Tract Population 2000 to 2010 (Source: ESRI Business Analyst, ARC Research and Analytics)
Map 2: Trends in Census Tract Population 2010 to 2020 (Source: ESRI Business Analyst, ARC Research and Analytics)
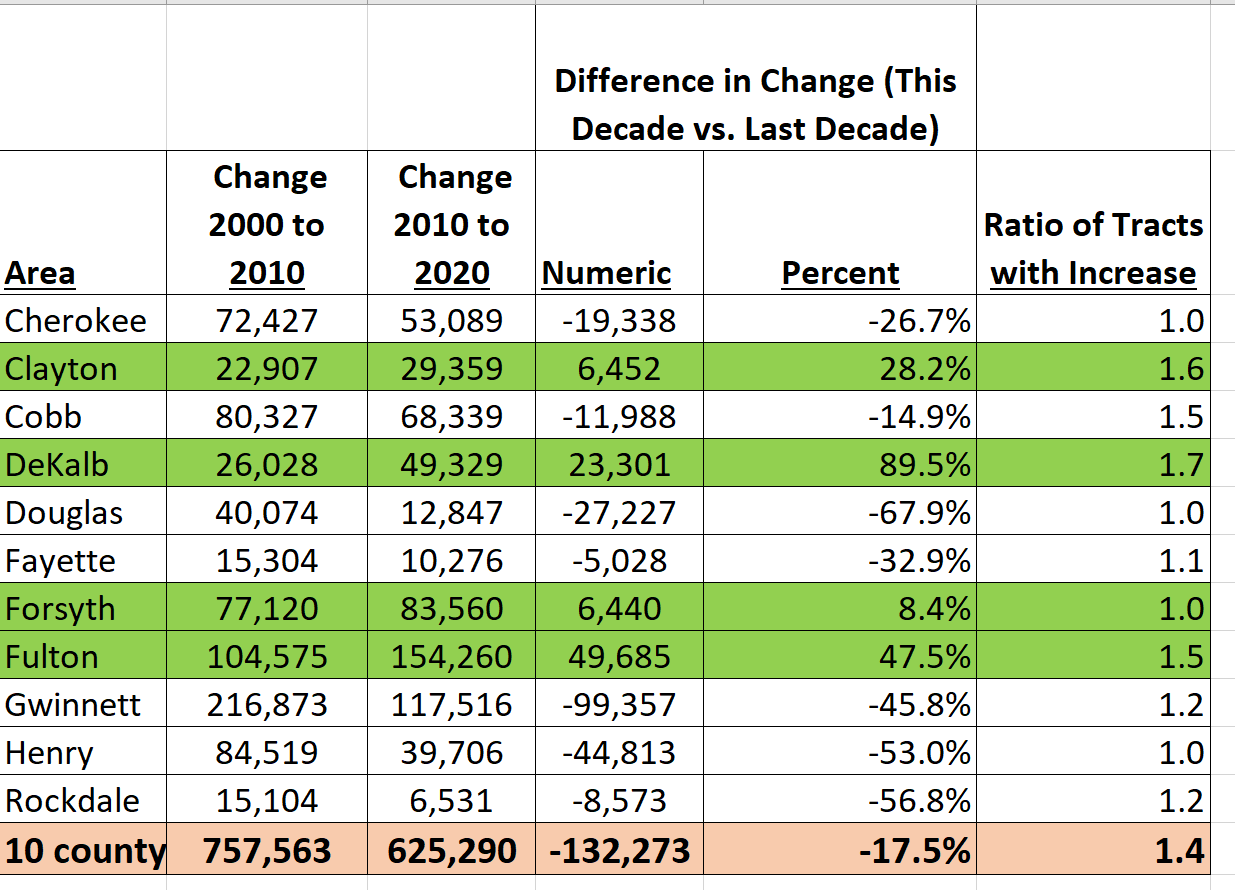
Rolling all these tract-level trends up to the county level gets more interesting and makes the conclusion even more nuanced! Table 1 below shows that at the 11-county region level, ESRI estimates that we had growth of about 100,000 more during the 2000-2010 period than during the 2010-202o period. Roughly half of our counties grew more and half grew less. Greater growth is estimated in core counties like DeKalb, Clayton, and Fulton, as well as in Forsyth (one of the faster-growing counties in the nation over the past three decades). DeKalb and Clayton appear to have rebounded from relative downturn during the 2000s, while Fulton’s relative boost this decade is largely owing to resurgence in the City of Atlanta. While there is still growth in suburban and exurban counties like Cobb, Gwinnett, Henry, Fayette, and Rockdale, that growth is at a slower pace this decade than in the 2000s.
And for a final fascinating (and a little non-intuitive) finding, check out the last column of the table. This calculation shows that MORE tracts (ratio of over 1.00) saw population increase (and fewer lost population) in the 2010-2020 decade than in the 2000-2010 period. So then, why the slowing of overall growth for half the counties and for the region as a whole? Because the tracts that DID grow 2010-2020 grew less (on average) than they did (on average) in the 2000-2010 period! To put a finer point on this really confounding contrast: (1) in the 2000-2010 period, 244 of the region’s 784 tracts showed a population decline, while for the 2010-2020 period, only 51 tracts declined, BUT (2) the average change across all the region’s tracts 2000-2010 was + 966, while the average change across tracts for the later 2010-2020 period was +798
Table 1: Comparing County Change by Decade (with Tract Shifts) (Source: ESRI BAO, ARC Research & Analytics)
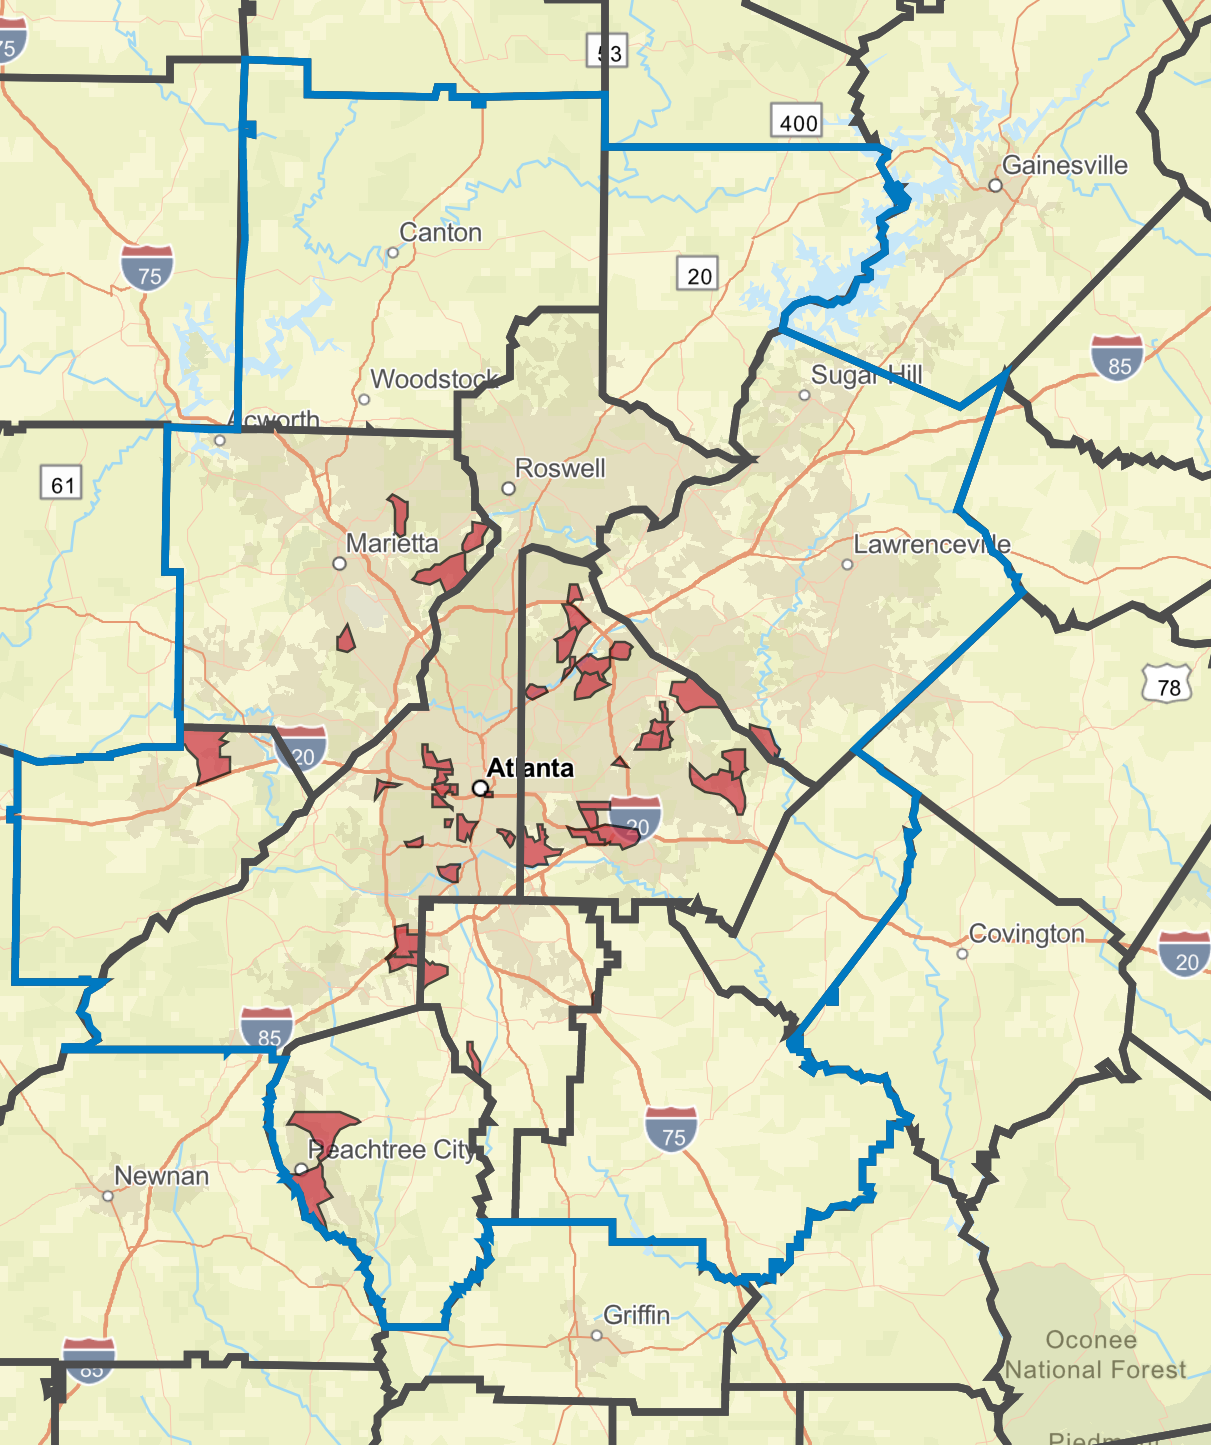
To make the above point a little plainer, spatially, we close with two more maps. The first isolates the tracts that decline 2000-2010; the second the tracts that decline 2010-2020. It’s easy to see that more tracts declined 2000-2010 period (Map 3) than declined in the 2010-2020 period (Map 4). But the ones that grew (and there were more of them) in 2010-202o grew less than they did in 2000-2010.
Map 3: Tracts that Lost Population 2000 to 2010 (Source: ESRI Business Analyst, Analysis and Mapping by ARC Research and Analytics)
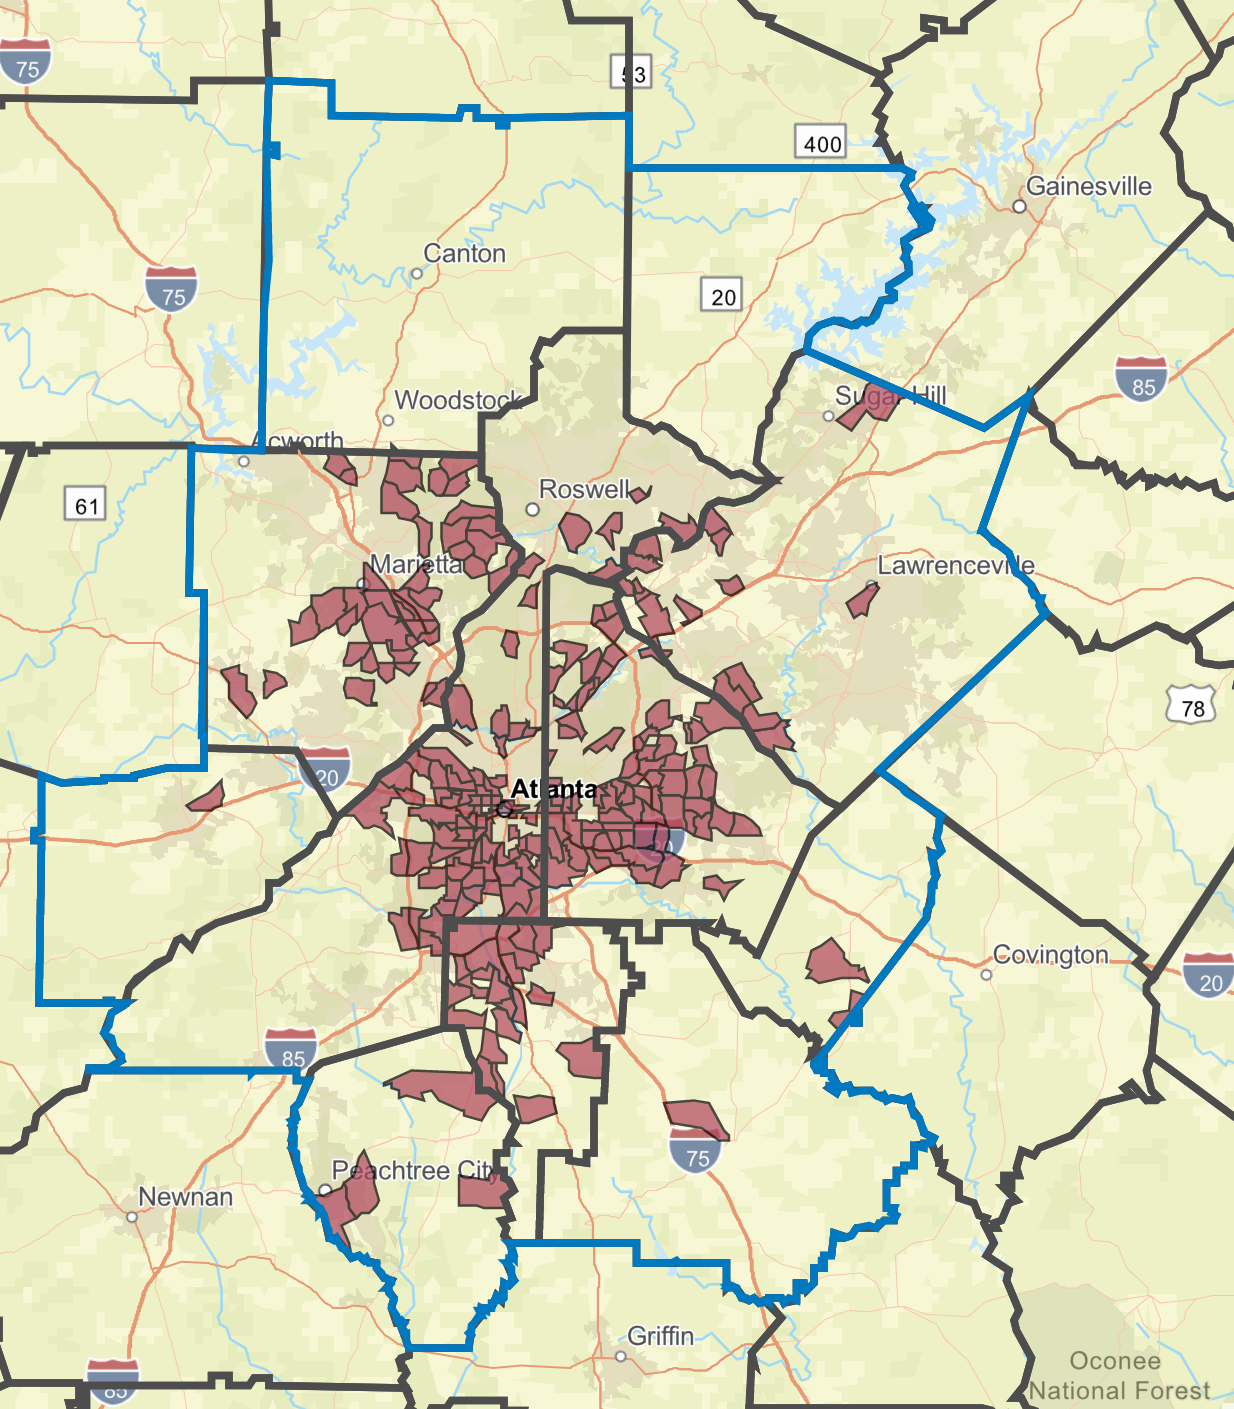
Map 4: Tracts that Lost Population 2010 to 2020 (Source: ESRI Business Analyst, Analysis and Mapping by ARC Research and Analytics)
