
Our most recent regional snapshot highlighted the updated version of our 100 Metros dashboard. The dashboard provides data about the Atlanta-Sandy Springs-Alpharetta MSA, how it compares to the country’s other most populous metros, and finally, presents data about those metros. Taken together, the tool helps to provide an impression of Atlanta’s place in the country.
The dashboard organizes metro data into seven buckets: Demographics, Housing, Education and Technology, Health, Employment, Economic Development, and Commuting. Today’s post explores the Employment bucket in particular. The following screenshot shows the workforce analysis for the Atlanta-Sandy Springs-Alpharetta MSA:
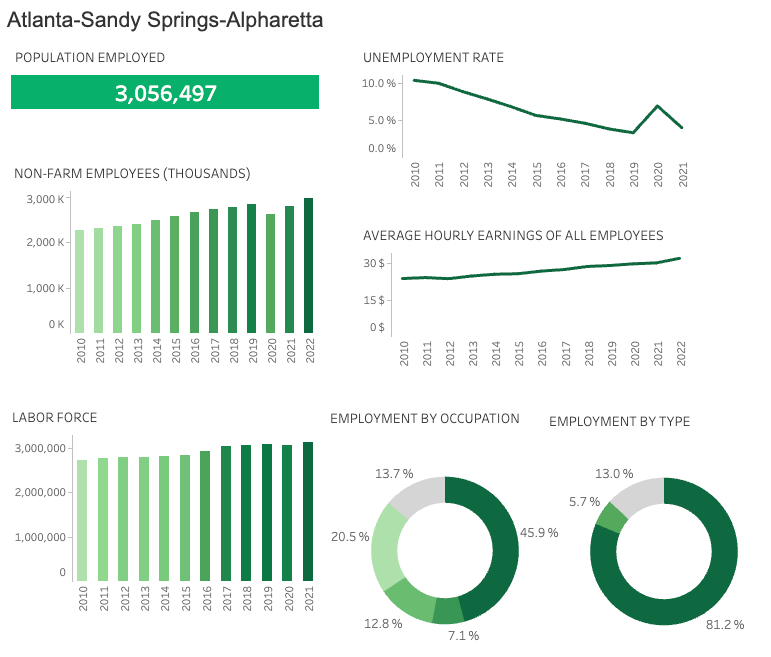
As shown in the top-left corner, Atlanta’s total employed population is just over 3,000,000. The total labor force (employed population + unemployed population) was 3.1 million as of the latest update to the dashboard. The total labor force in the MSA dipped slightly in 2020 (down to 3,056,030 from 3,090,100 in 2019) but rebounded the following year. In a similar post-COVID trend, the number of non-farm employees in metro Atlanta has quickly rebounded from a low of 2,618,000 in 2020 to 2,985,000 in 2022, a growth rate of just over 14% over that 2-year period.
The unemployment rate has come down in our metro since peaking at 6.9% in 2020; as of 2021, the rate has fallen to 3.9%. However, we note this rate is not as low as pre-COVID levels, as we observe the lowest rate on the chart to have been 3.2%, a rate observed in 2019. For comparison, Charlotte’s 2021 unemployment rate is 4.6%, Nashville’s is 3.6%, Houston’s is 6.4%, Dallas’ is 5.1%, and Miami’s is 4.9%.
Atlanta’s jobs are heavily focused in the private sector; just over 81% of the employed populations works in this sector, while 13% are employed by the government, and 5.7% are self-employed. Houston and Nashville have a similar share of workers employed in public sector as compared to Atlanta, with 12.7% of each metro’s workers being employed by the government.
These metrics only scratch the surface of the vast amount of information available for each of the top 100 metros in the country. While this post highlights some of the high-level findings regarding employment, you can drill down for much more detail. For now, happy data exploring!