100 Metros Comparison Dashboard
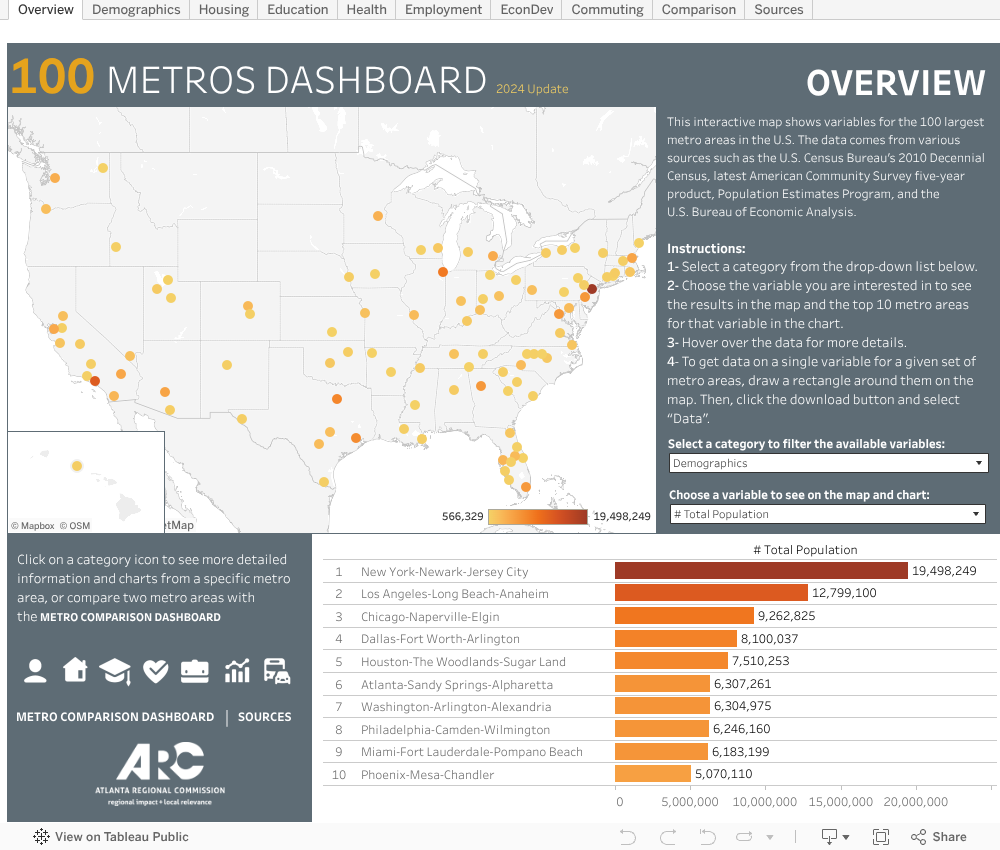
This interactive map shows variables for the 100 largest metro areas in the U.S. The data comes from various sources such as the U.S. Census Bureau’s 2010 Decennial Census, the U.S. Census Bureau’s latest American Community Survey five-year product, and the U.S. Bureau of Economic Analysis.
Instructions:
1- Select a category from the drop-down list below to determine the variables shown in the next filter.
2- Then choose the variable you are interested in to see the results in the map and the top 10 metro areas for that variable in the chart.
3- Hover over the data for more details.