It’s back to Census data in this post, and not just 2020 but back all the way to the roaring 1990s! We take a look at average household size (AHHS)–an indicator that’s not that easy to pull out from the redistricting data released so far. Below you will first find time trends for “larger areas” (the state, the metro area, the ARC 11 counties, and the five core counties: Clayton, Cobb, DeKalb, Fulton, and Gwinnett; then, later on in the post, for individual counties in the ARC Region. The headline(s): if you have been reading anything about the “national trend” in household sizes and population growth, you’d think that they have been decreasing pretty much everywhere with lower fertility and the like but recent evidence says “not so fast” . And what we have found closer to home bears that out. Across the ARC Region, AHHS increased between 1990 and 2000, but ticked down for the last two decades of the analysis, and yet ended up again pretty much where it “started” in 1990. At the county level, the news is even more nuanced.
Chart 1: Comparative Areas, 1990-2020: Average Household Size (Source: US Census, ARC Research & Analytics)

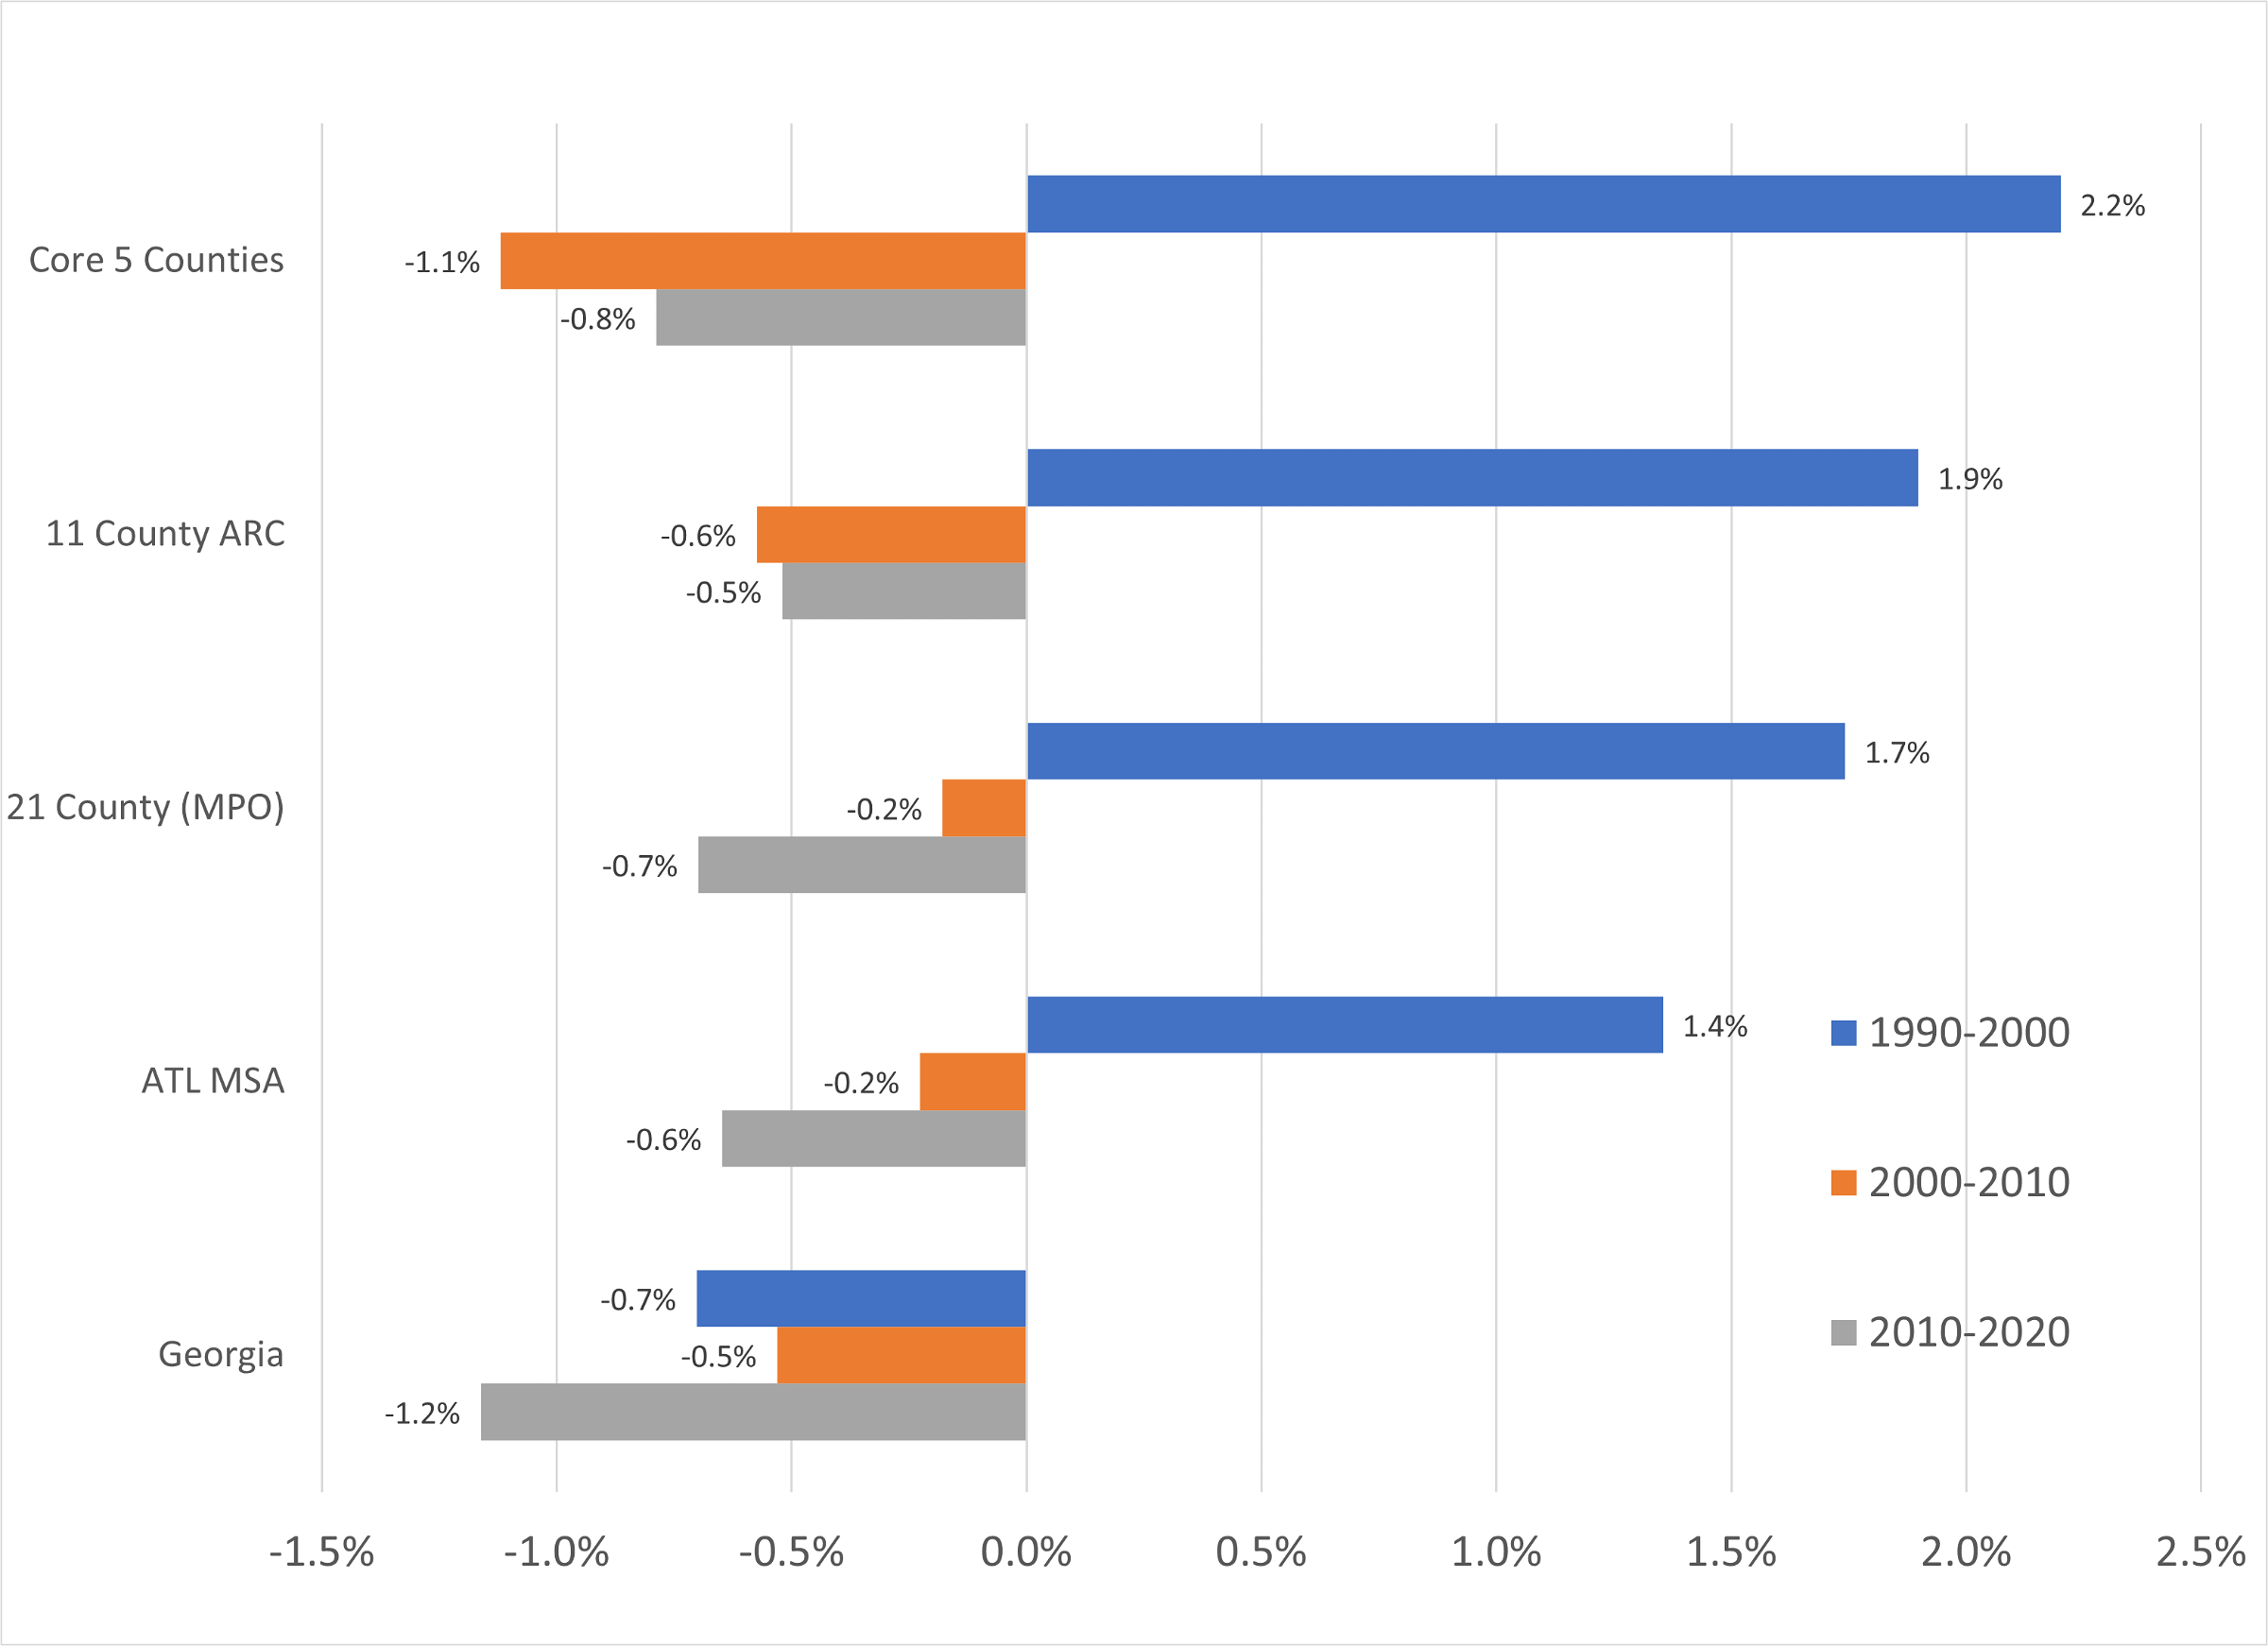
Let’s begin how we like to begin: comparing trends in larger areas. As shown in Chart 1 (above), Georgia in 1990 had the highest average household size (of any of the areas) in 1990 but had dropped to just over the AHHS of the five- county core by 2020. And amongst the five areas only the state as a whole decreased consistently between 1990 and 2020. although AHHS did decrease in all of the comparative areas from 2000 through 2020. Chart 2 below looks at percentage change for the “larger areas”, and the trends in the five-county core are the most interesting. The 1990 to 2000 increases in average household size were greatest there—and yet that area retained the smallest overall household size. The trend quickly reversed itself 2000-2010 and then in the last decade, as the five- core county area had the largest decline (of the comparative areas) in average household size.
Chart 2: Comparative Areas, Percent Change by Period– Average Household Size (Source: US Census, ARC Research & Analytics)
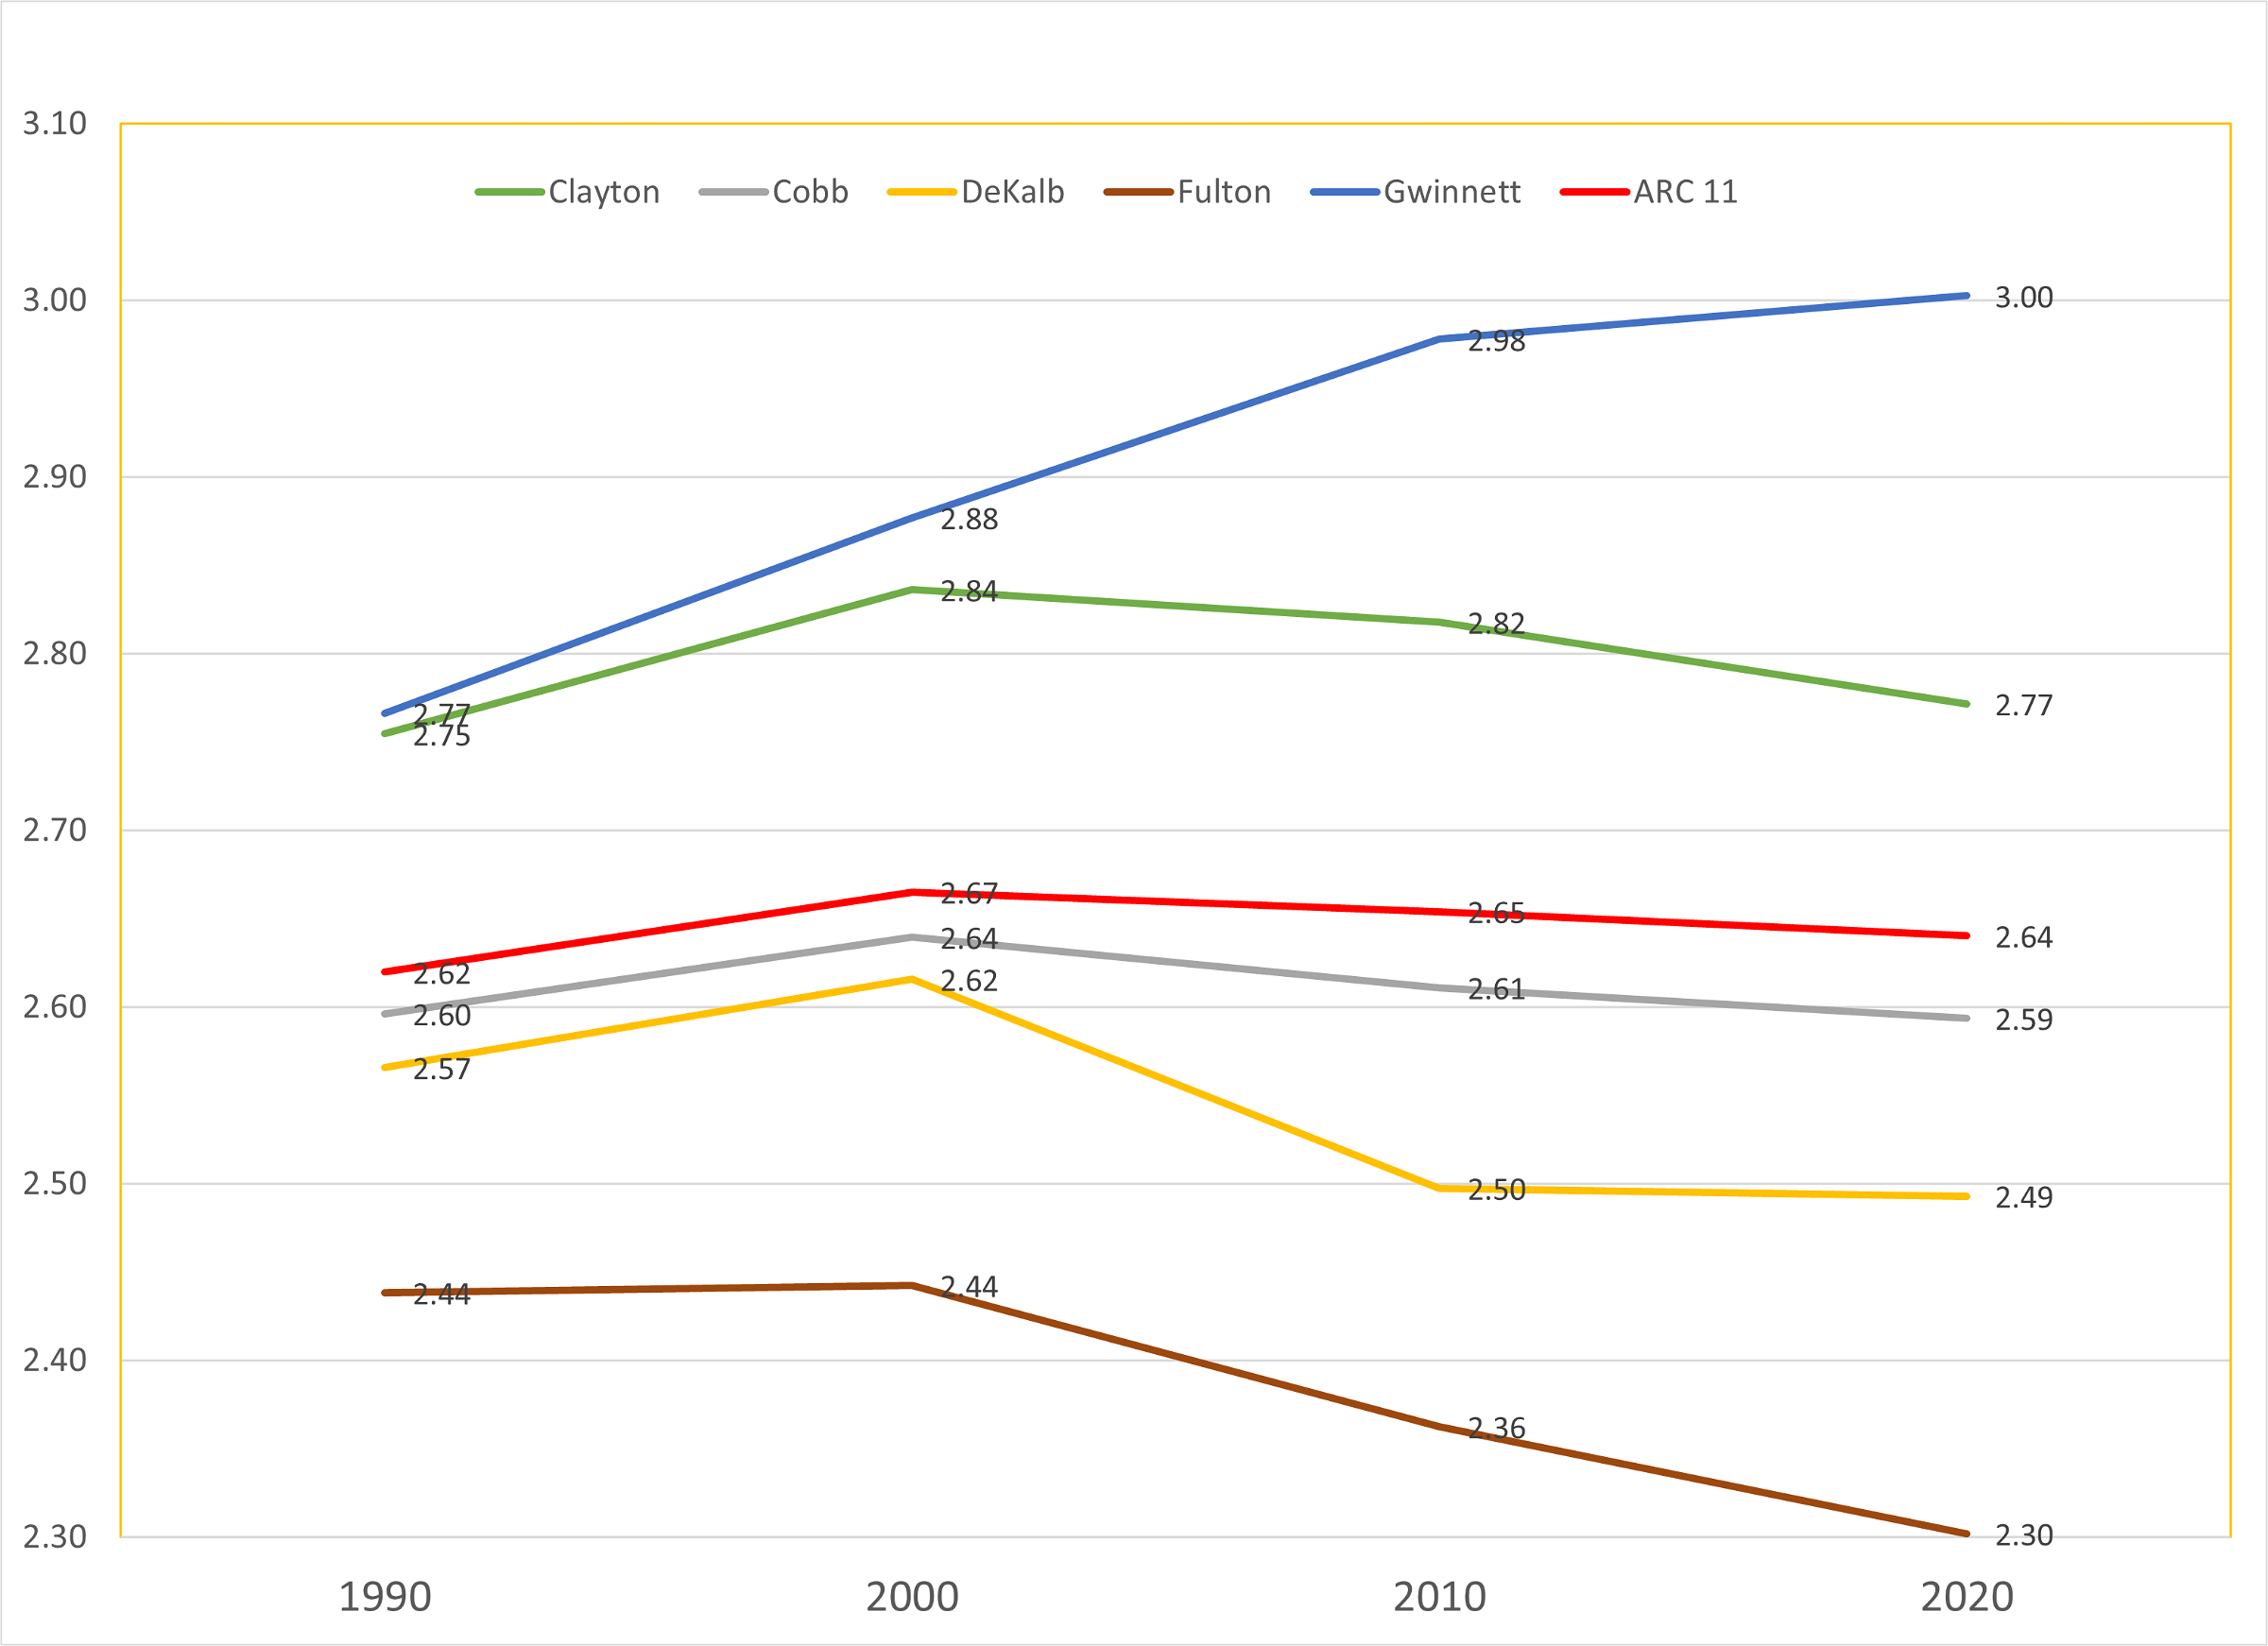
And now drilling down to counties, we find a lot more complexity. Chart 3 shows that seven of the ten counties have an average household size above the regional average. For most of the years of the analysis periods, Gwinnett and Forsyth are consistently the highest levels and have increased the fastest between 1990 and 2000. Chart 4 focuses on the five core counties, which are typically below the regional AHHS average. Gwinnett is a very notable exception, with the region’s highest average household size. Gwinnett and Fulton have very different household size characteristics and that gap has expanded 1990-2020.
Chart 3: Trends by County, 1990-2020: Average Household Size (Source: US Census, ARC Research & Analytics)
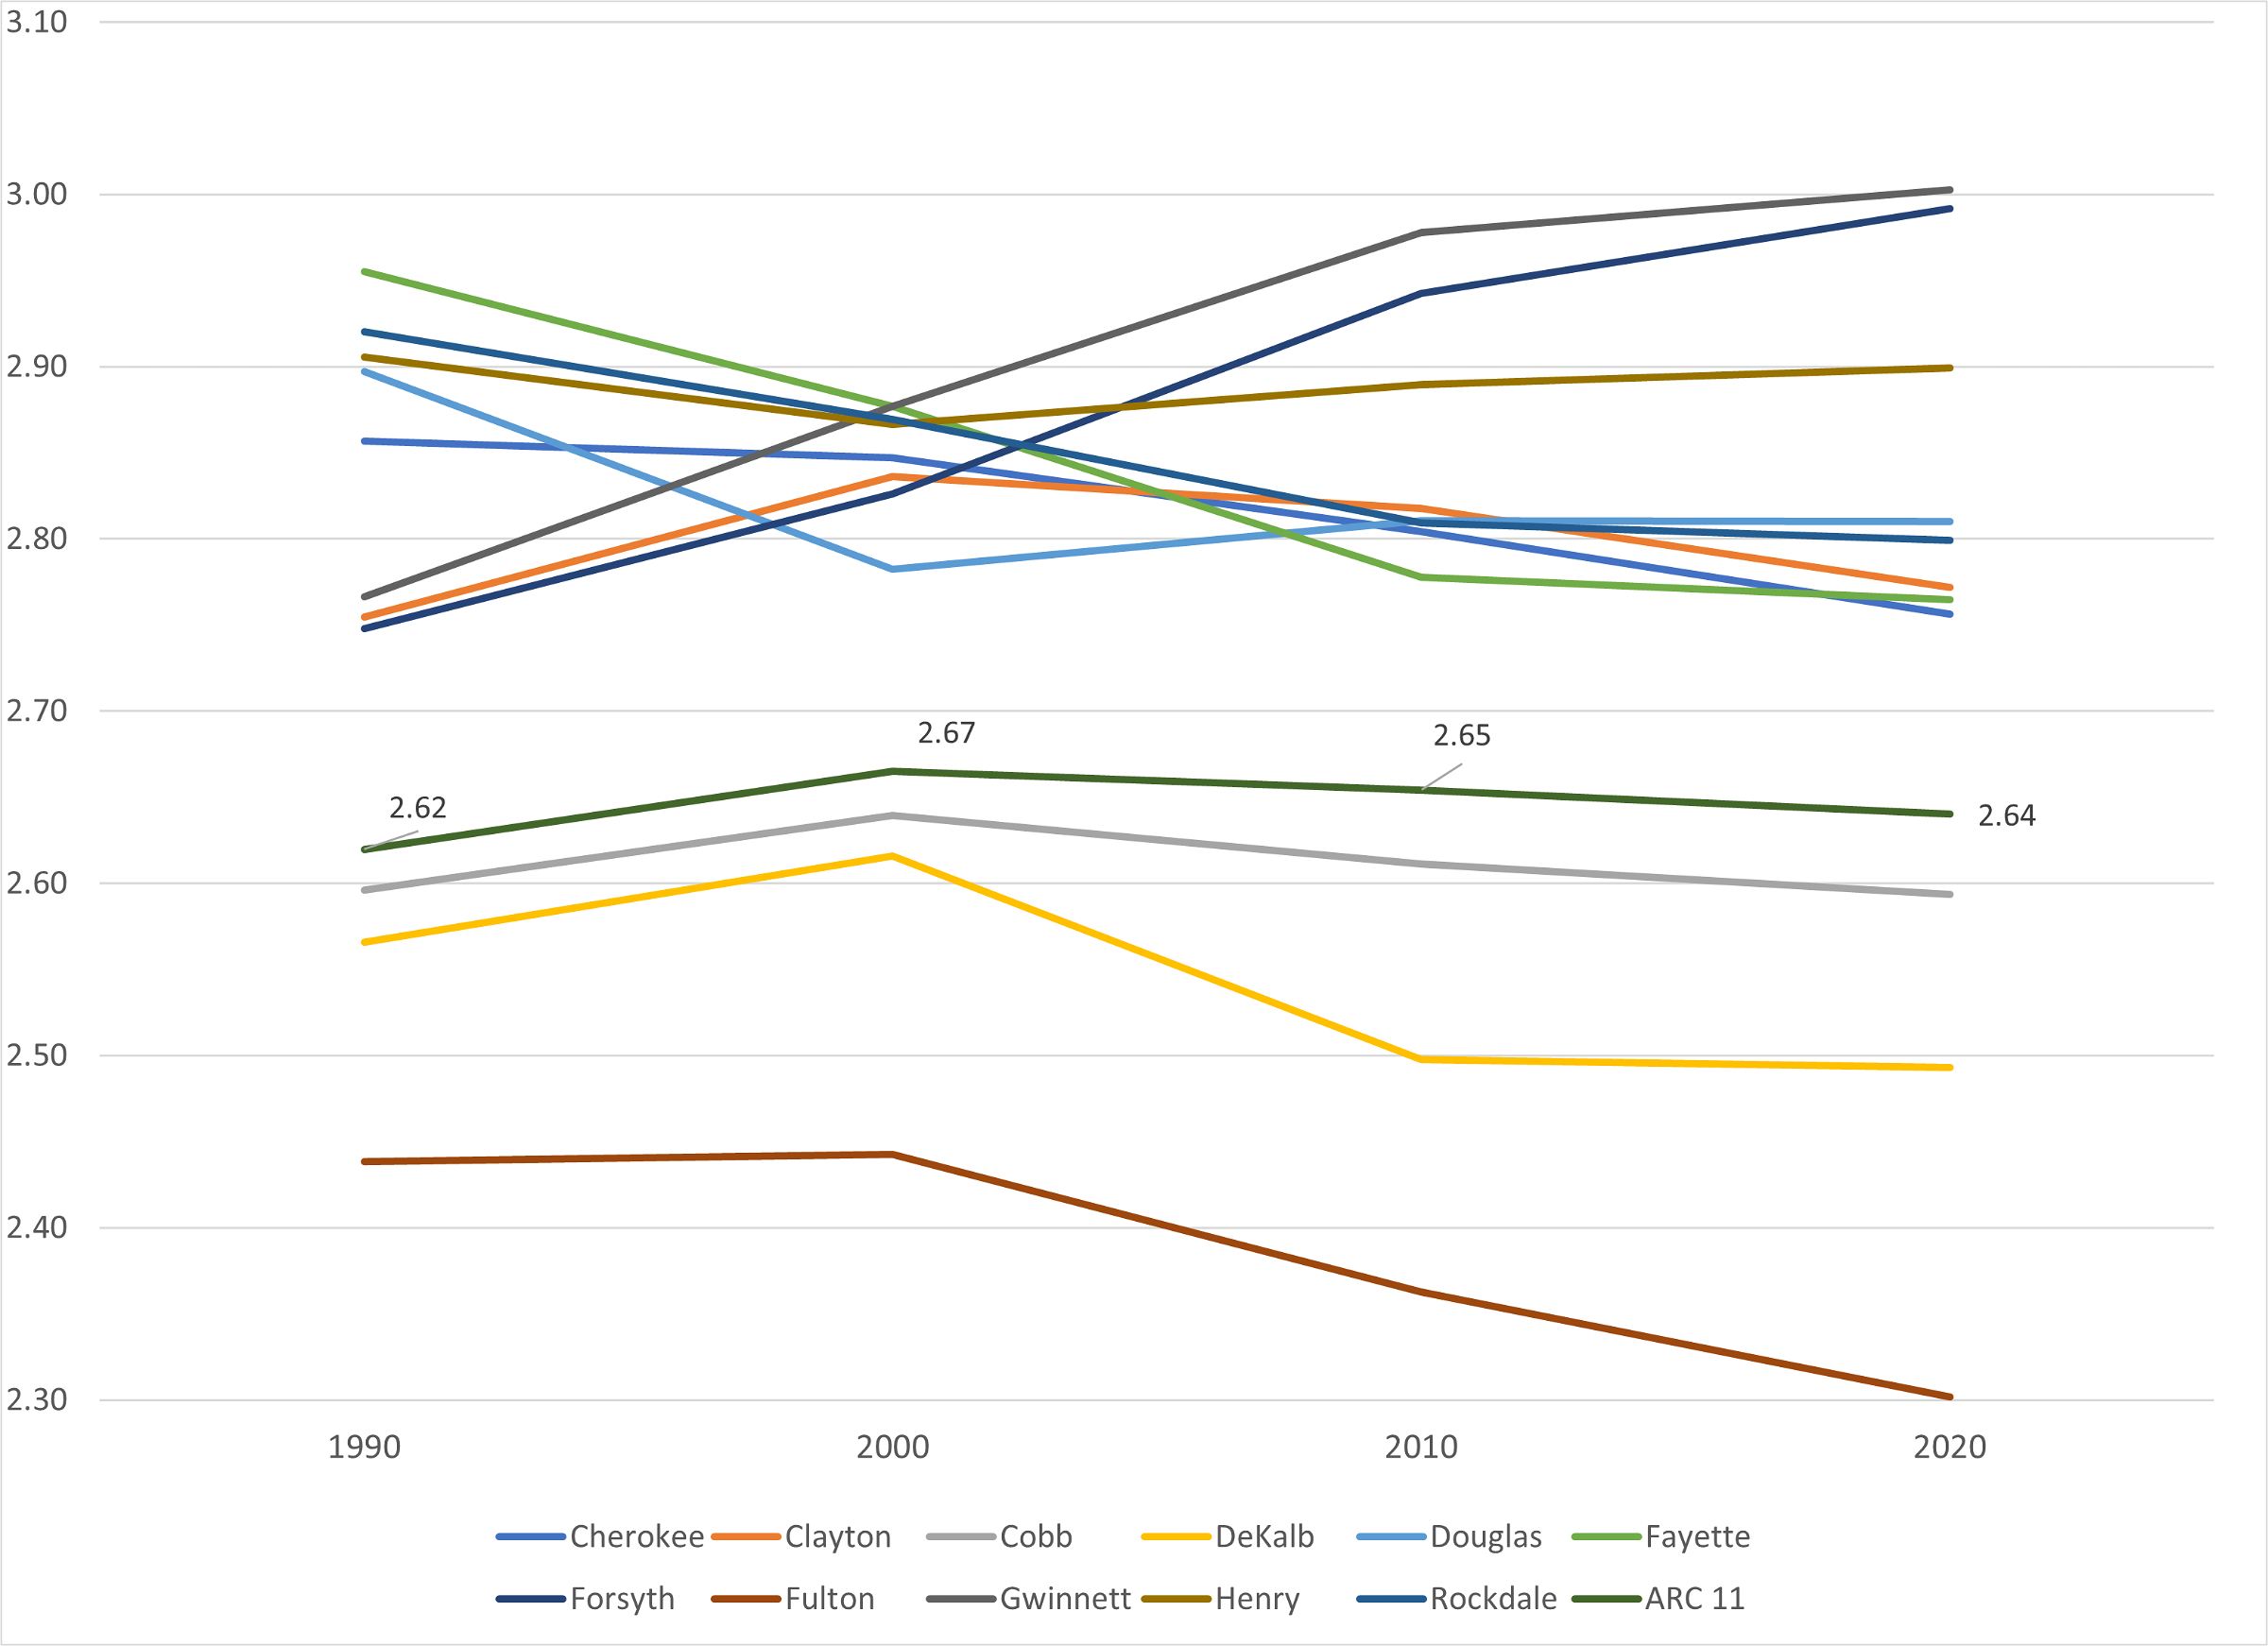
Chart 4: Average HH Sizes for 1990-2020: A Focus on Core Counties (Source: US Census, ARC Research & Analytics)
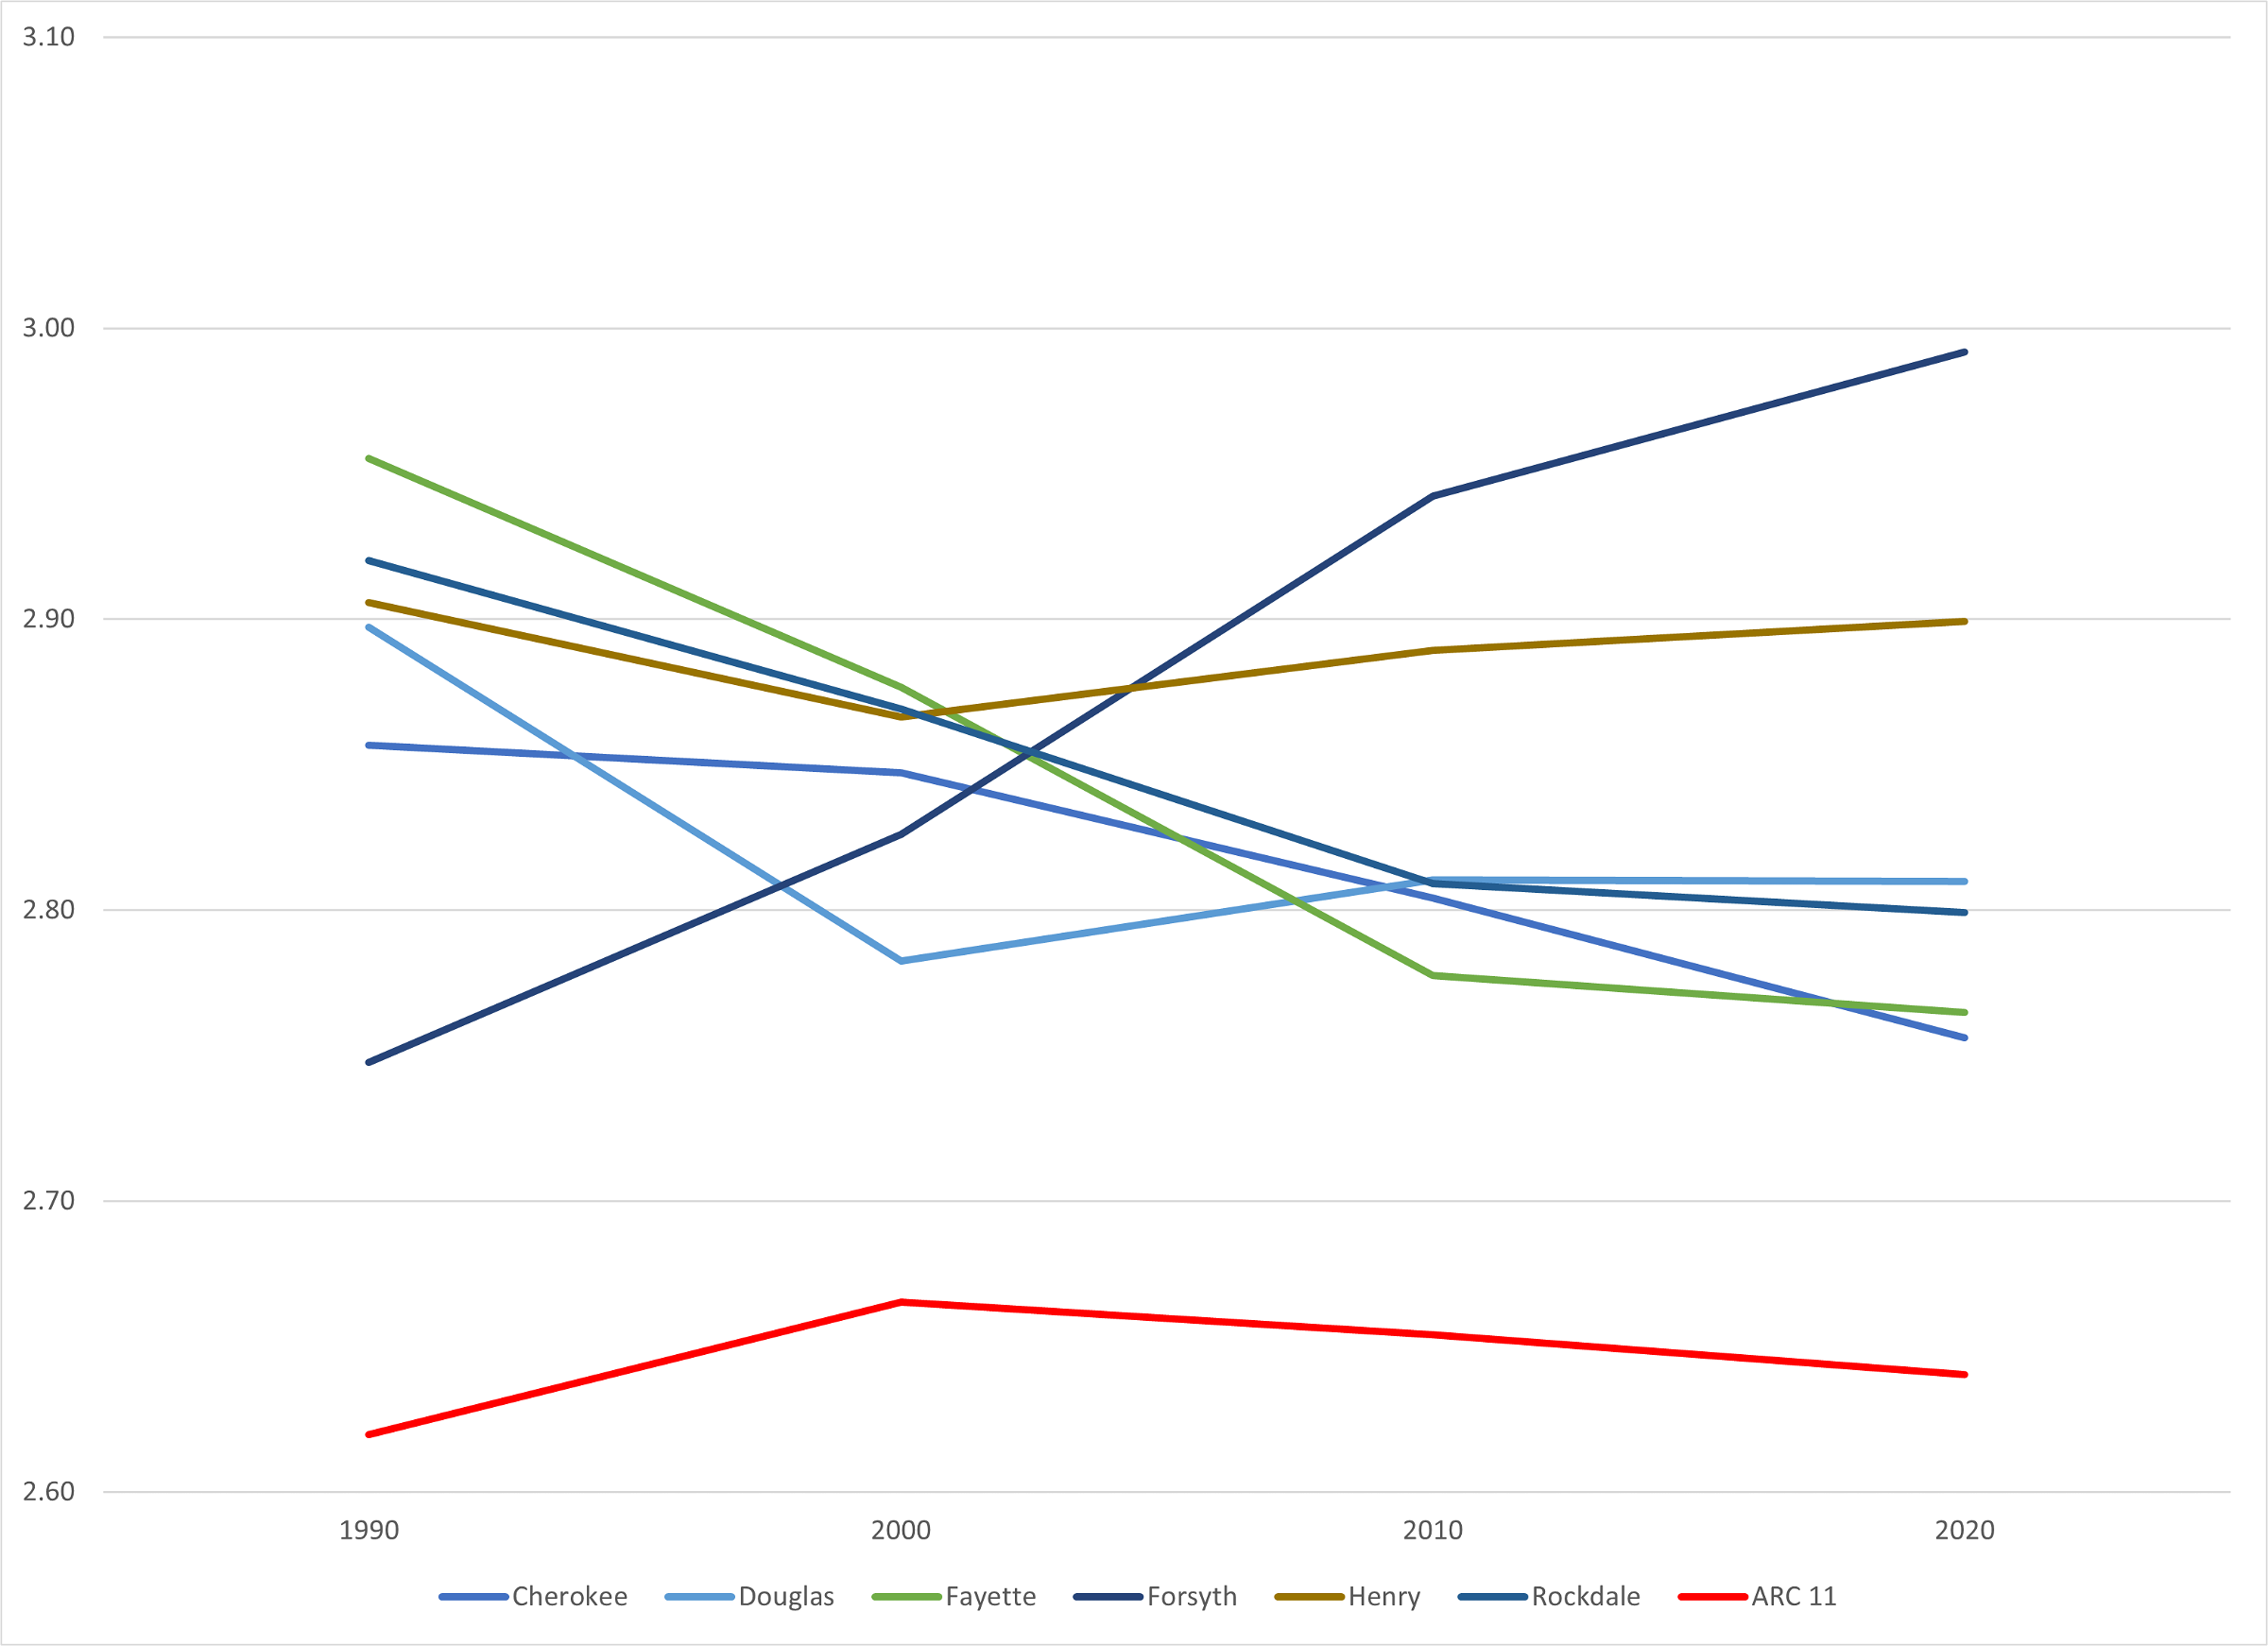
All six suburban counties shown in Chart 5 have average household size above the ARC Region average from 1990 through 2020. But the gap between these suburbs and the 11 county average has narrowed for every county but Forsyth over the analysis period. The most notable decline of AHHS is in Fayette County–most likely due to the rapid aging of that county’s population over the three analysis decades.
Chart 5: Average Household Size 1990-2020: A Focus on Suburban Counties (Source: US Census, ARC Research & Analytics)
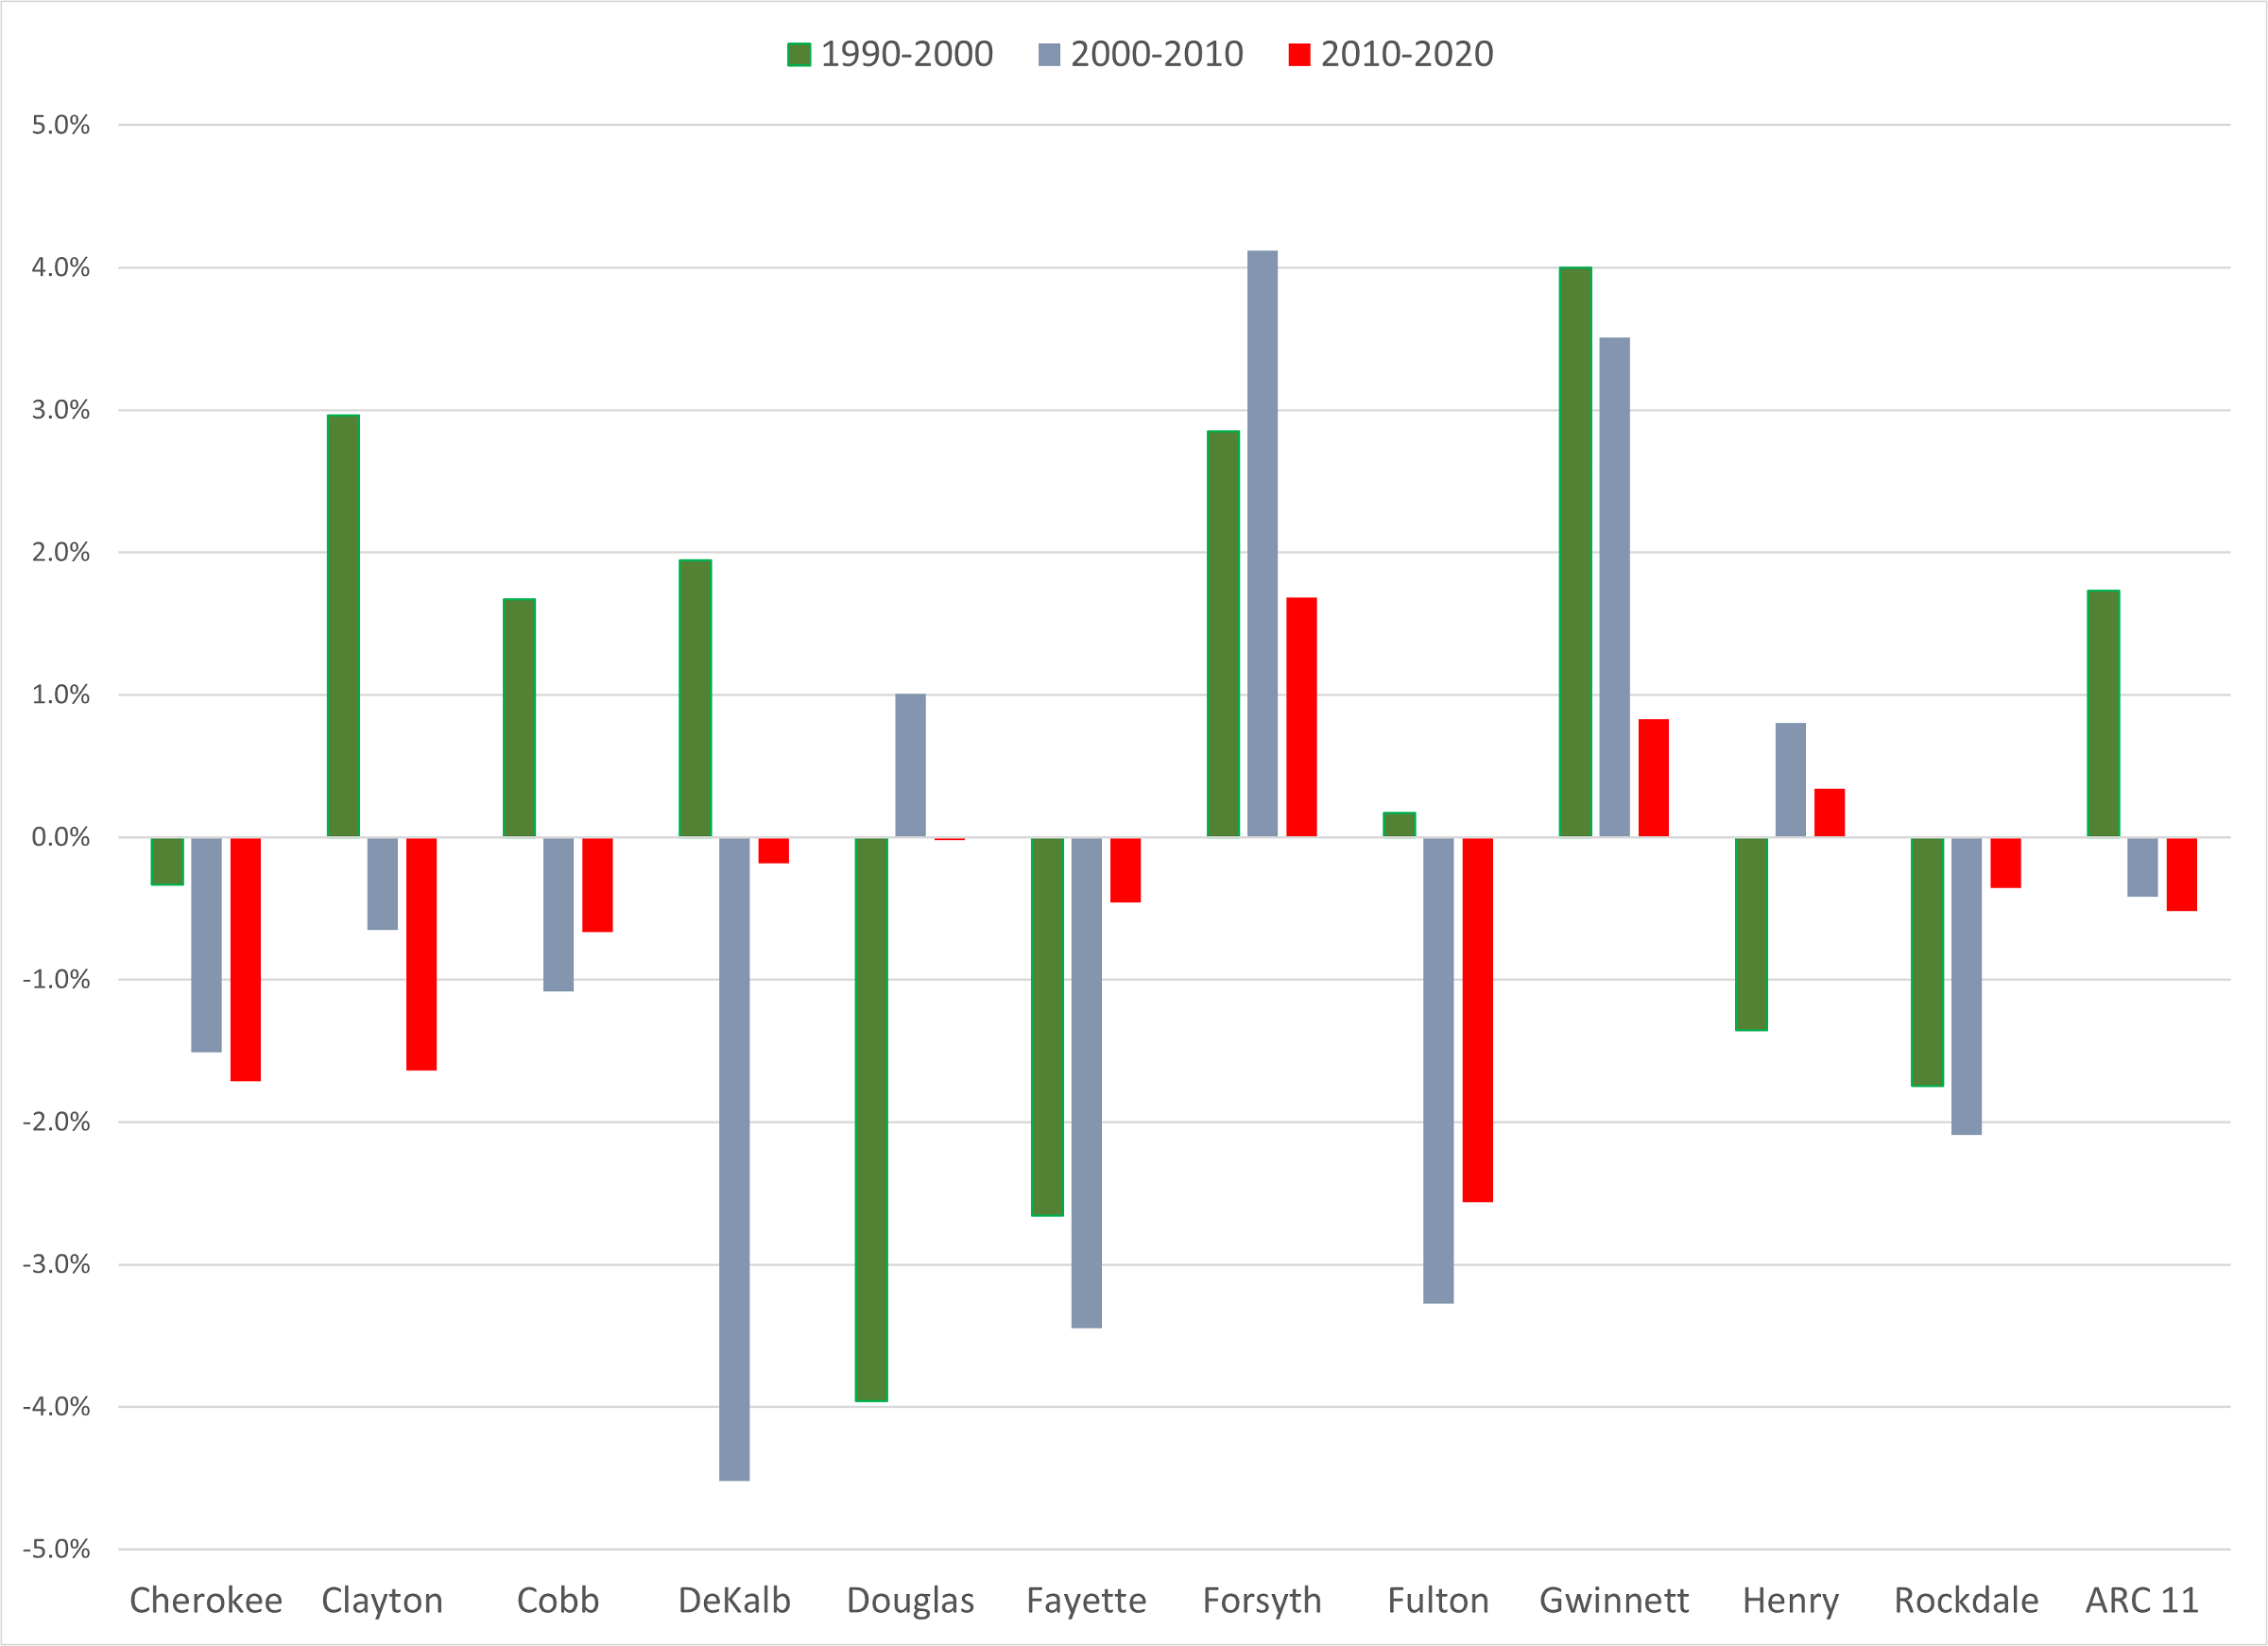
In the final chart below (Chart 6), we see that in six of eleven regional counties, average household size increased on a percentage basis between 1990 and 2000. But moving to the next 10-year block of 2000 to 2010, AHHS increased in only four of the eleven, and in the last decade, it grew only in three counties (Forsyth, Gwinnett, and Henry—three of the fastest population growth areas). A few of the other more notable percentage changes are (a) Fulton’s steady decrease 2000 to 2020, driven by multifamily high-rise building and gentrification in the City of Atlanta; (b) Henry’s recent increase–it was one of only four counties with decreasing AHHS between 1990 and 2000, but then was one of only two counties (Douglas the other) to increase between 2000 and 2020; (c) Fayette, Cherokee, and Rockdale AHHS decreased in each ten- year period.
Chart 6: County Average Household Size Change by Period, 1990-2020 (Source: US Census, ARC Research & Analytics)