
Monday Mapday
Maps showing themes and trends, published on Mondays

Georgia’s Non-Hispanic Black Population, from 2010 to 2020
We're kicking off Black History Month with an updated look at the state's Black population at the Census tract level, as well as examining change since 2010.
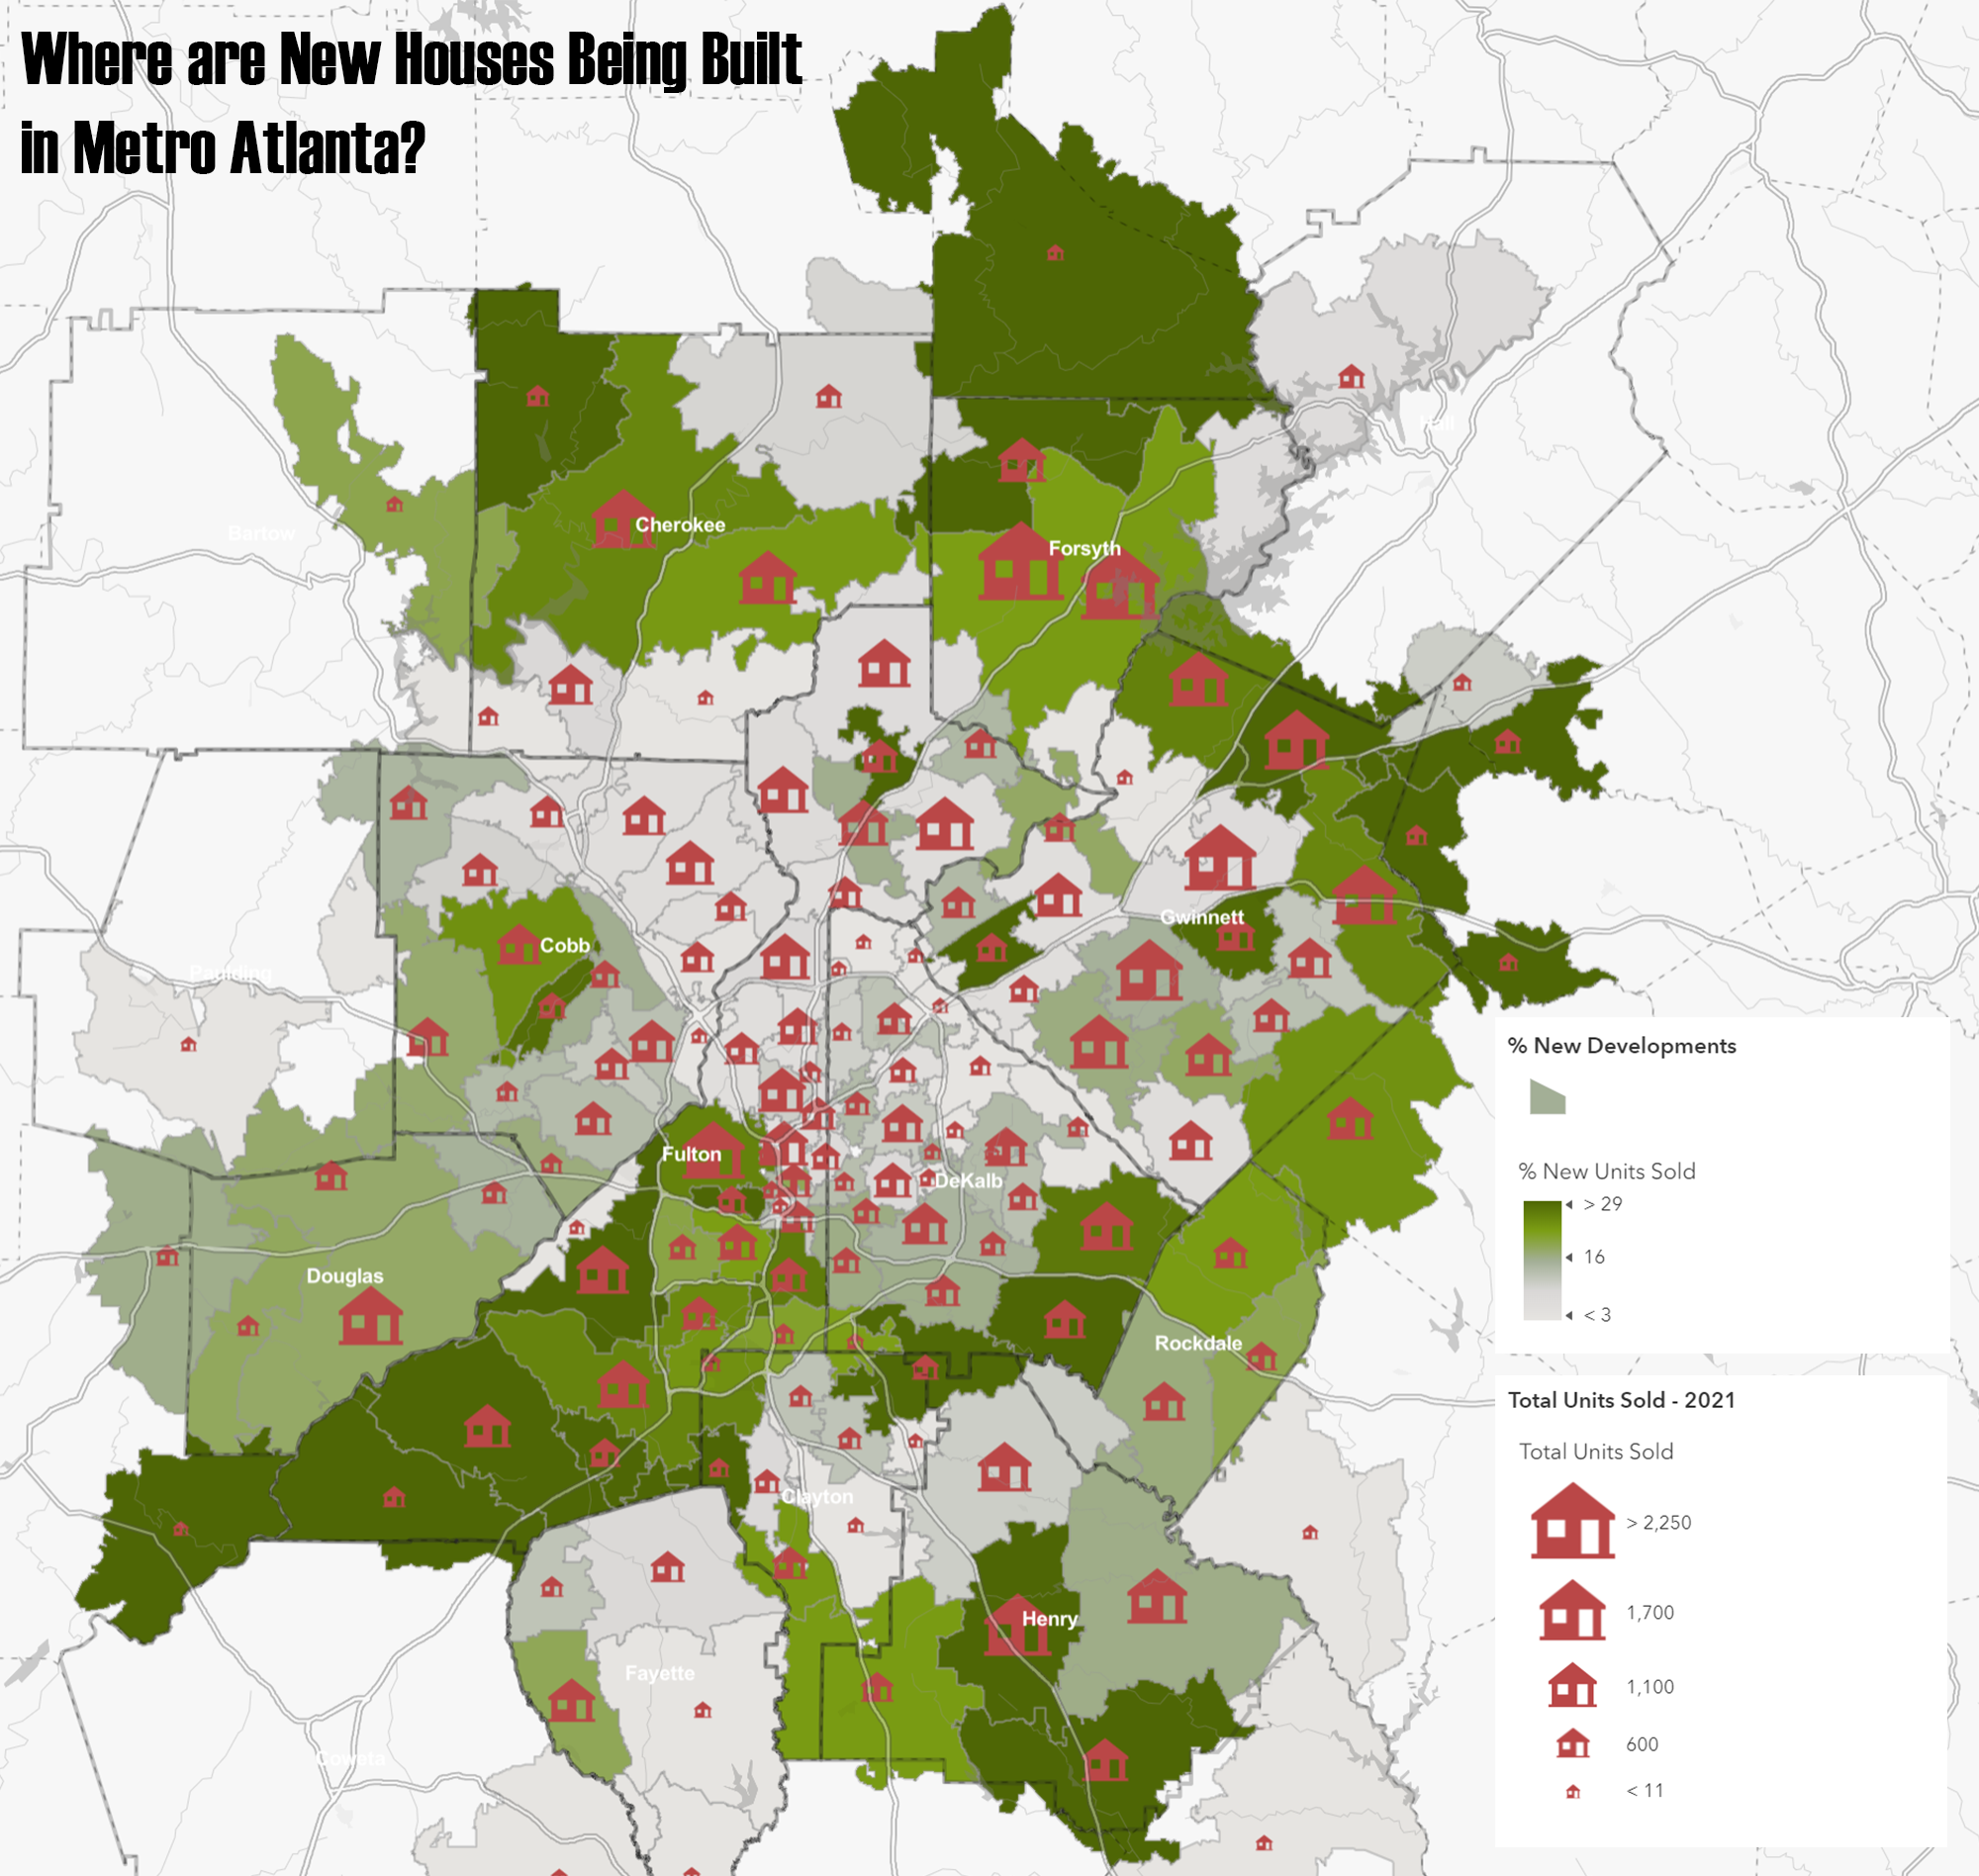
Just How Hot is Atlanta’s Housing Market?
The housing crisis is hardly unique to our area, but that doesn't make it any easier to address. We analyze new data from MarketNsight to pull out some interesting details about the price distribution and spatial patterns of new development in our region.
Computer and Internet Access Across the 11-County Area
With schools considering a return to remote learning to prevent omicron surges among students and faculties, it's again worth a look at which communities are best positioned to handle quick switches and where we see the largest shares of school-age children.
Estimating Santa’s Stress, 2021
A very scientific approach to estimating Old Saint Nick's stress levels as he traverses the 11 county area.
Changing Demographics: Race and Ethnicity, 1990 to 2020
An animated map showing how our diverse population has grown and moved over time.

Celebrating Native American Heritage Month 2021
Native American heritage month has arrived. This set of static maps shows territories in Georgia and throughout North America.