
Monday Mapday
Maps showing themes and trends, published on Mondays

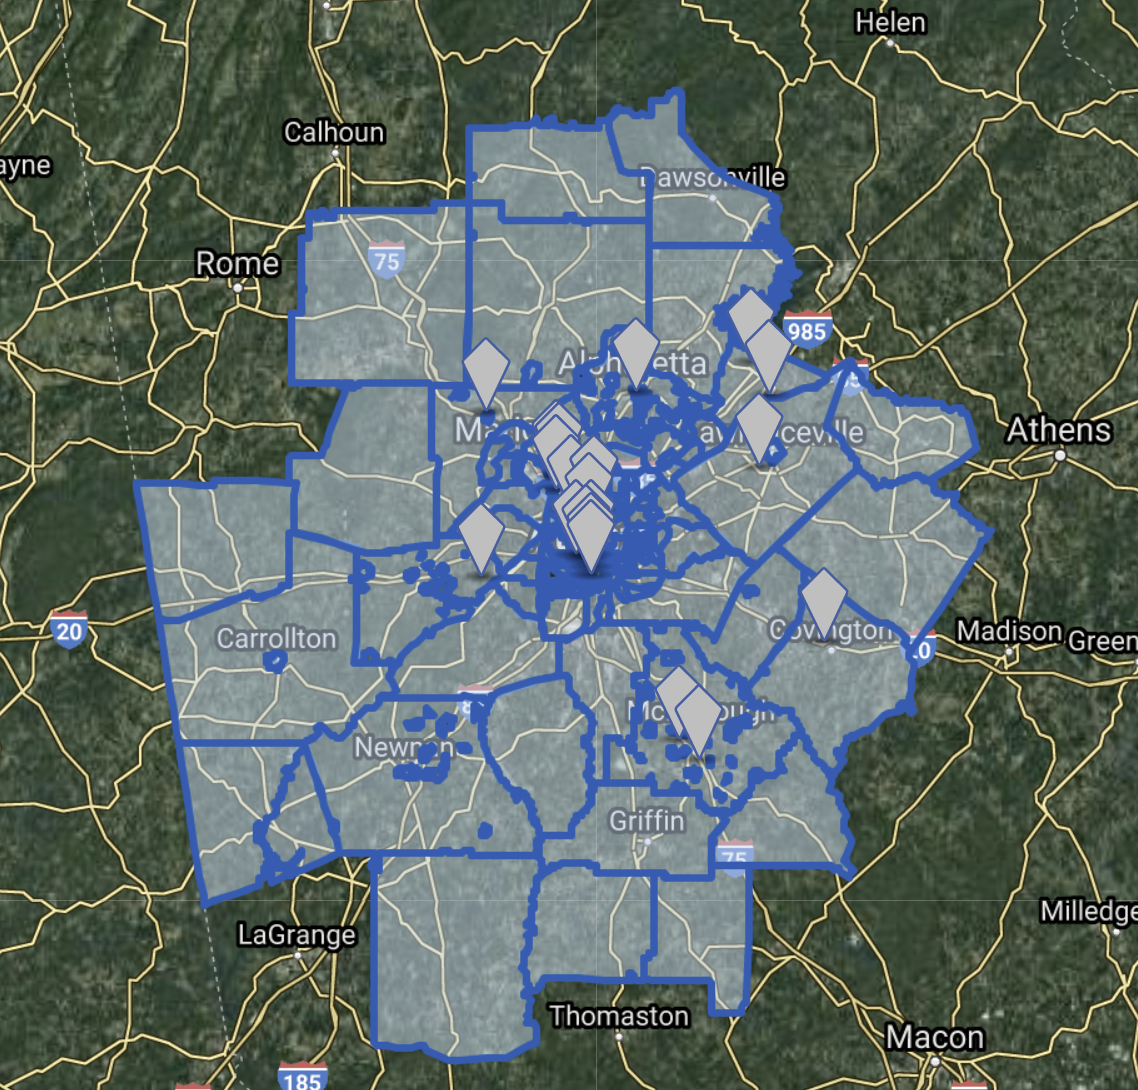
Follow the Money: Mapping the Best Trick-or-Treat Destinations in the Atlanta Region
Yes, we've mapped where you're most likely to get a lot of trick-or-treaters ... but more importantly, we've mapped where the candy spending is highest per household.
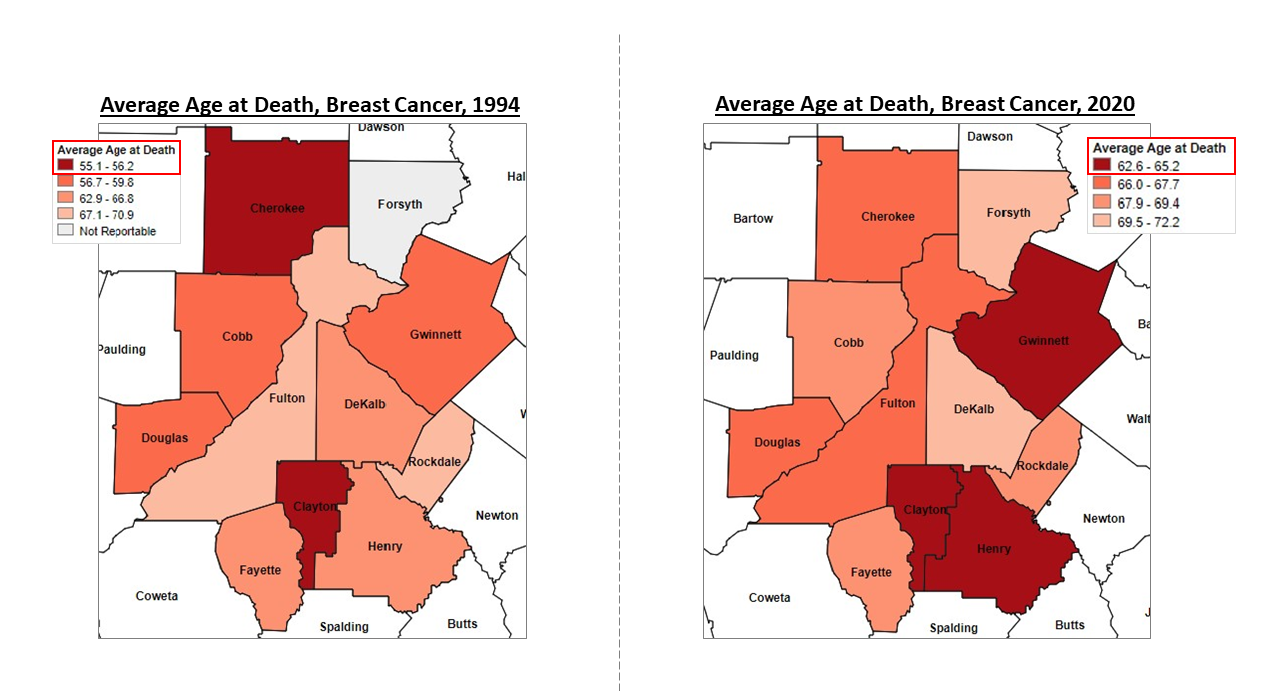
Breast Cancer Awareness Month 2021: Incremental Improvement
Finding reasons for optimism and what work the 11-county area still has ahead of it when it comes to battling breast cancer in the future.
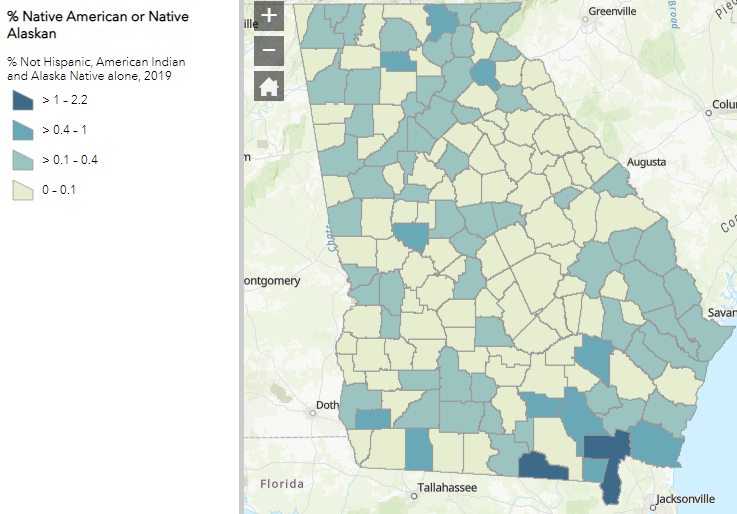
Indigenous Peoples’ Day 2021
To celebrate Indigenous Peoples' Day, we created an interactive map showing shares of Native Americans living in counties across Georgia.
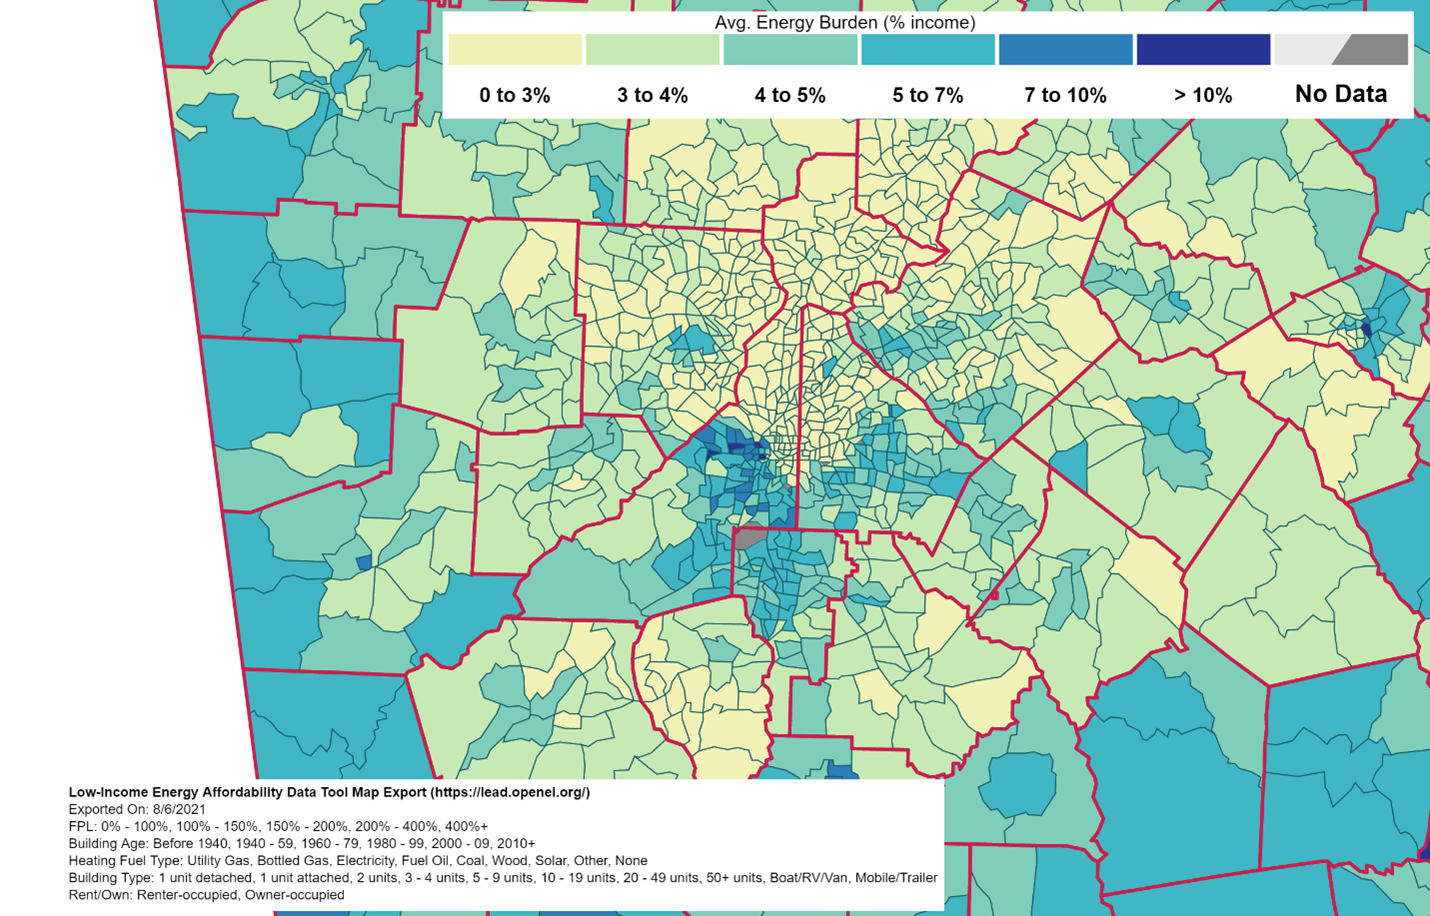
Mapping Energy Burden in the Metro
A new tool created by the U.S. Department of Energy and National Renewable Energy Laboratory helps identify neighborhoods where residents are most likely to be energy burdened.
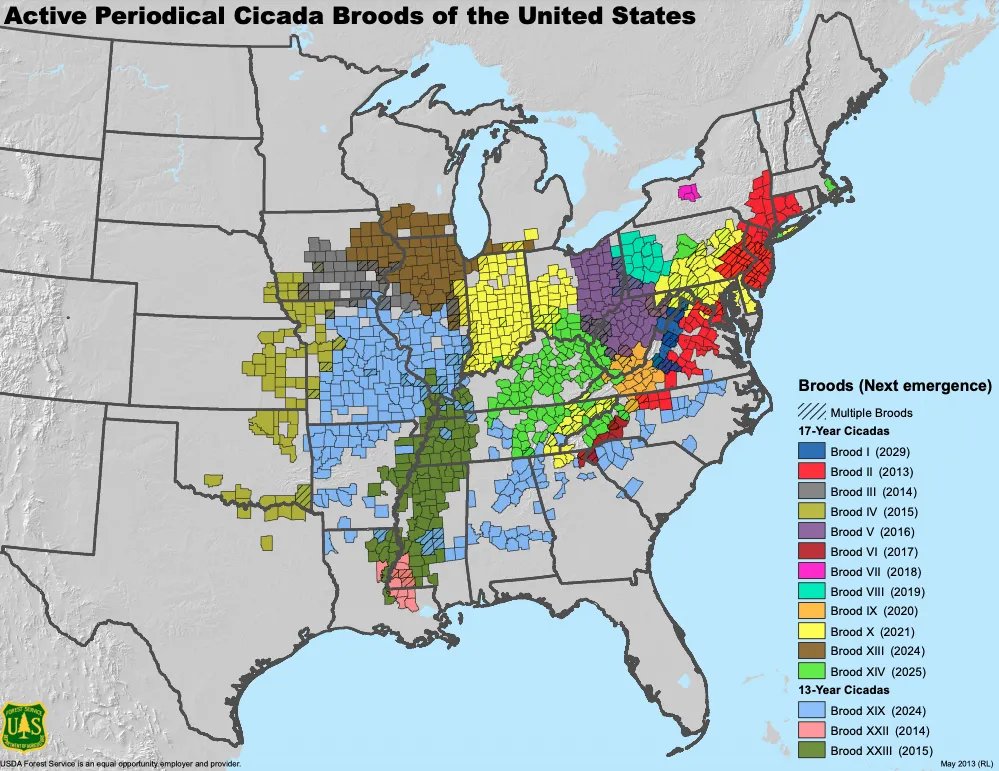
What’s the Buzz about all those Cicadas?
Mapping periodical cicada broods ... might we recommend grabbing earplugs and armchairs before nature's next full-volume concert?
Multifamily Momentum: Slowed, Not Stalled
In the last decade, multifamily housing has driven a significant share of the population growth in core areas of our region. Multifamily activity has slowed in recent years, and even in the heyday years of Atlanta multifamily construction, building in the sector was relatively constrained compared to single-family in Atlanta and to multifamily building in other metros.