
We all know that Santa has a herculean job delivering toys on Christmas, but where is he most likely to face the biggest challenges? We have some maps to help you determine just how many cookies and how tall a glass of milk you might want to treat everyone’s favorite jolly old elf to this Saturday.
Below, we’re taking a look at the percent point change of children under age 18 living in ARC’s 11 member counties between 2000 and 2019. And since we’re estimating stress, we’ve highlighted areas of growth in red since we anticipate that greater shares of children are indicative of a higher delivery load and, therefore, more stress. Areas of loss are in green … not because we like that the population under 18 has decreased but, rather, because we believe Santa is less likely to feel delivery anxiety when flying his trusty sled over those Census tracts.
Santa’s stress measure #1: Change in population younger than 18
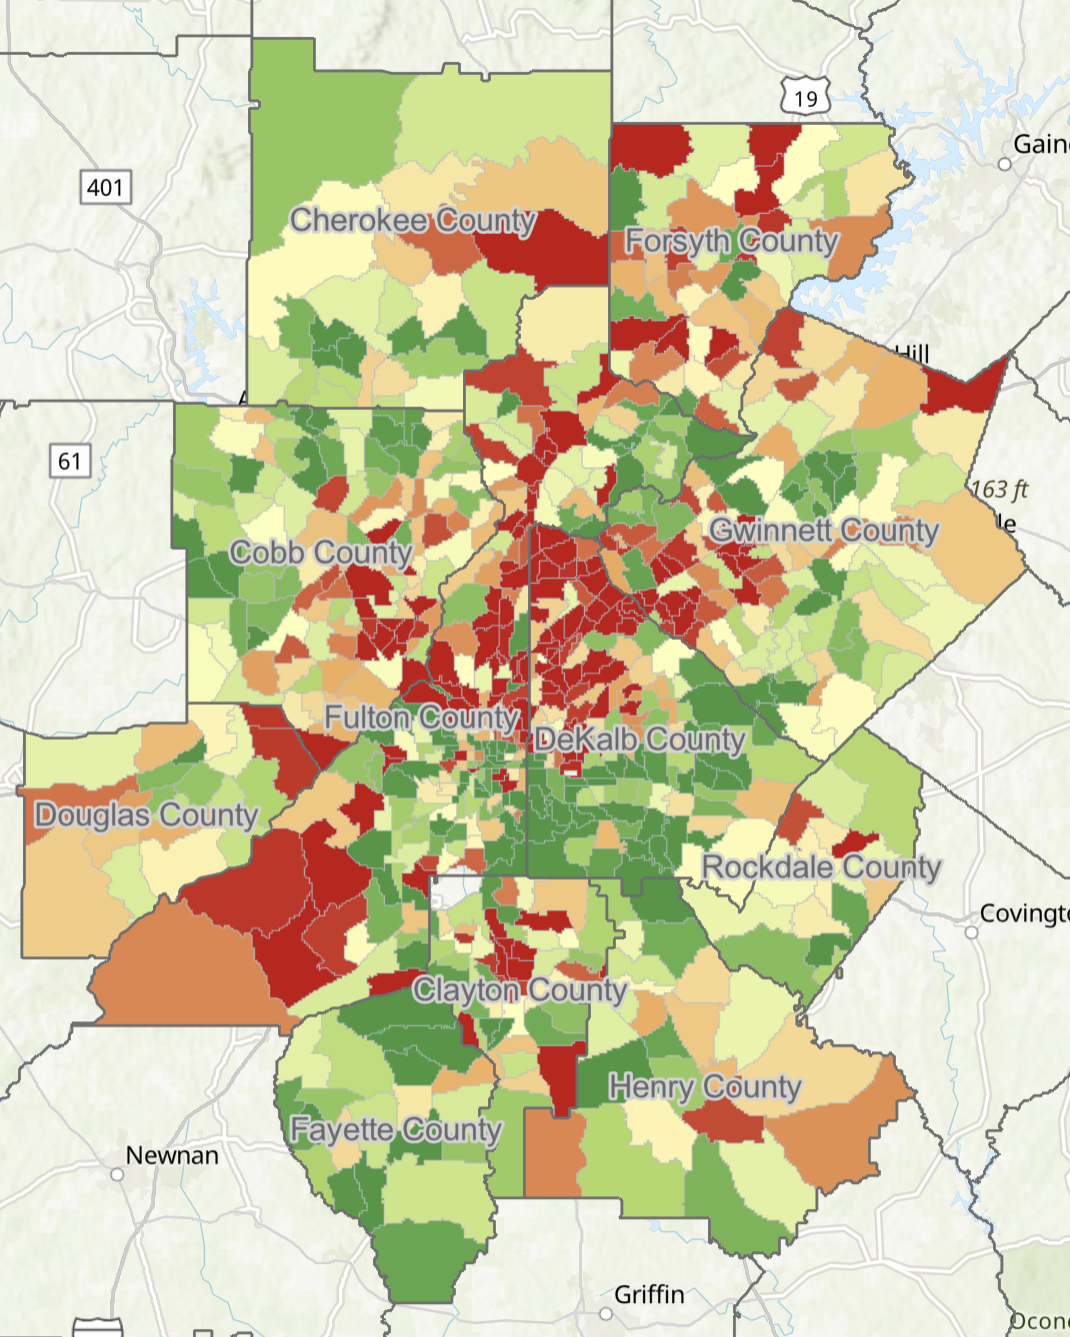
Source: 2015-2019 American Community Survey rolling averages and 2000 Census, with processing and analysis by ARC.
There is, however, more to the story of the night before Christmas than just shares of children overall. There is also the issue of the age of children, since kids younger than, say, 10 have much different expectations for their gifts than ones older than 10. So below we’re taking a look at what age group of children dominates Census tracts across the 11 counties. What can we glean? In many of the areas where we see growth in shares of children, we’re also seeing that the growth is coming from the younger age groups.
Santa’s stress measure #2: Age of the kiddos
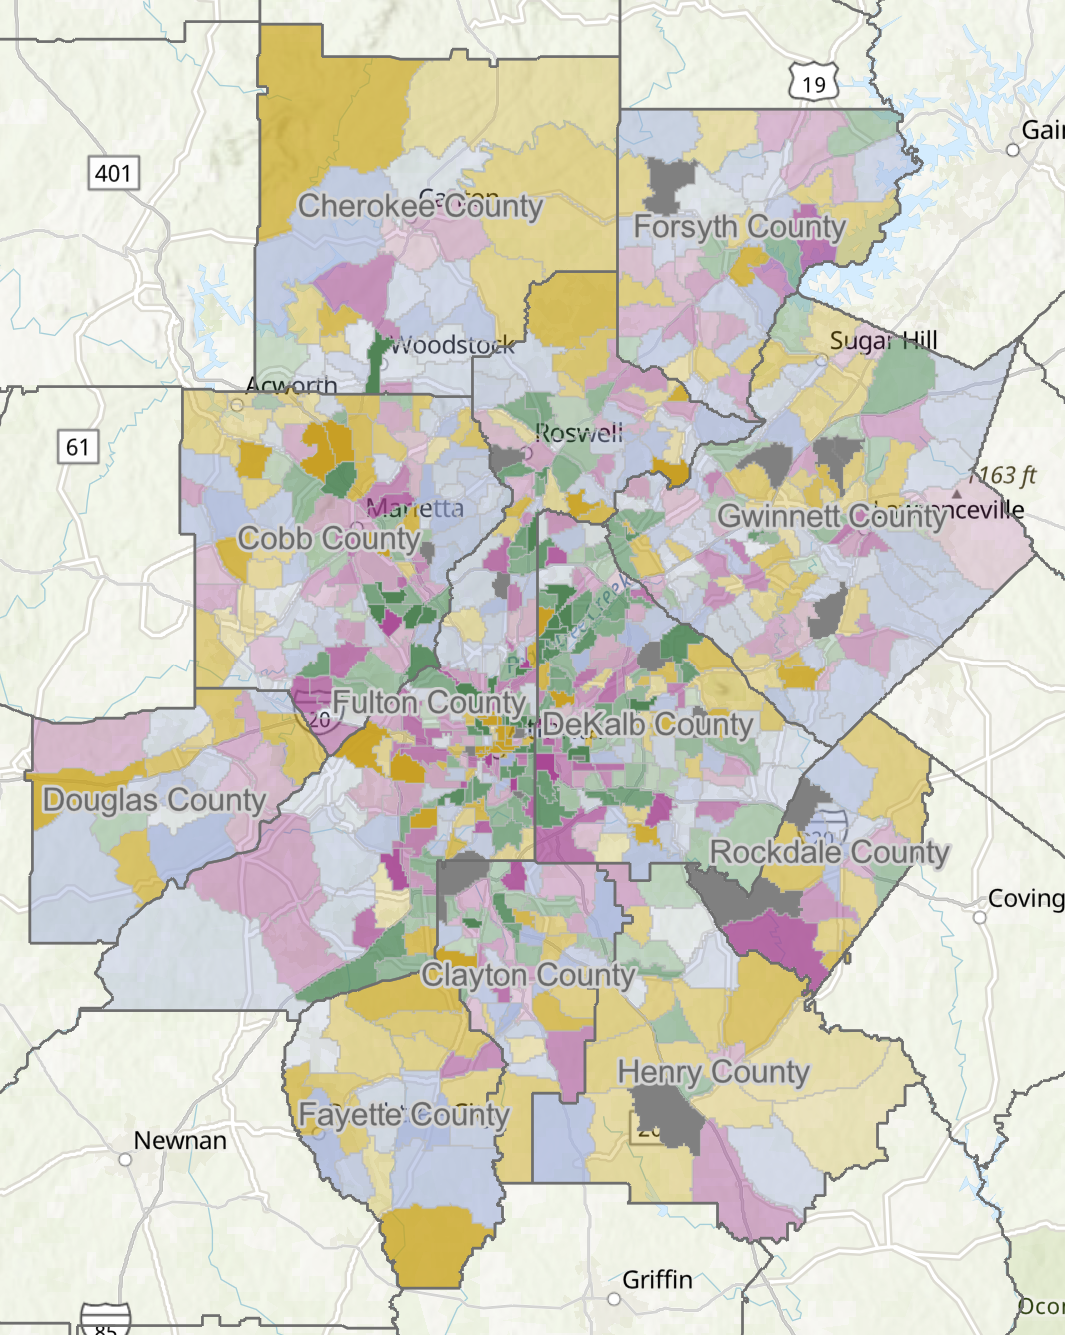
Source: 2015-2019 American Community Survey rolling averages, with processing and analysis by ARC.