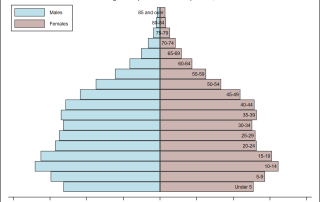
Regional Snapshot: National Aging Trends and the Atlanta Region
For Older Americans Month, the latest data on trends in and planning for the national and Atlanta aging population

For Older Americans Month, the latest data on trends in and planning for the national and Atlanta aging population
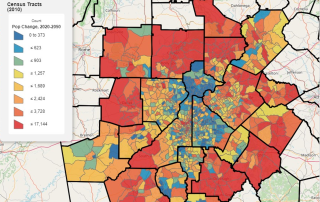
A new series (Series 17) of adopted regional and small-area forecasts associated with and supporting a new Metro Transportation Plan (MTP)
Where do veterans live in the Atlanta region?
A very early look at 2023 results from the largest survey of perceptions and beliefs done in the Atlanta Region
It's Hispanic Heritage Month, and we're taking a look at the age patterns of (Hispanic) population over time.
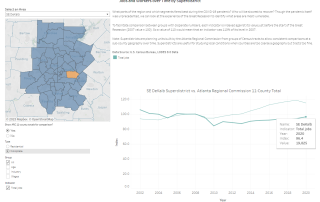
Explore 2023 ARC Population Estimates (and Highlight Findings) for its Dues-Paying Member Jurisdictions
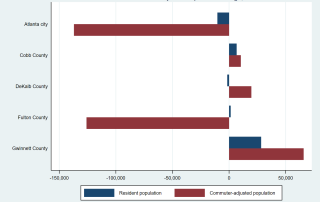
Trends in residents and commuters by area: a new pandemic paradigm?
Creating and exploring an index baselined to the eve of the Great Recession) that spatially tracks jobs, workforce wages, and workforce age composition over time.
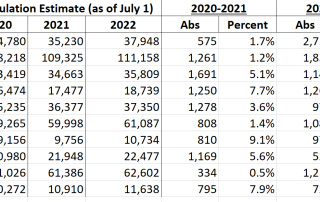
2022 city-level estimates from the Census Bureau came out recently. Here's a review of some interesting trends--for the state and region-- from 2020-2022
Georgia County Population Growth on the Move: A Century (+) Cartogram