By Hae Seung Sung and Faustina Jones
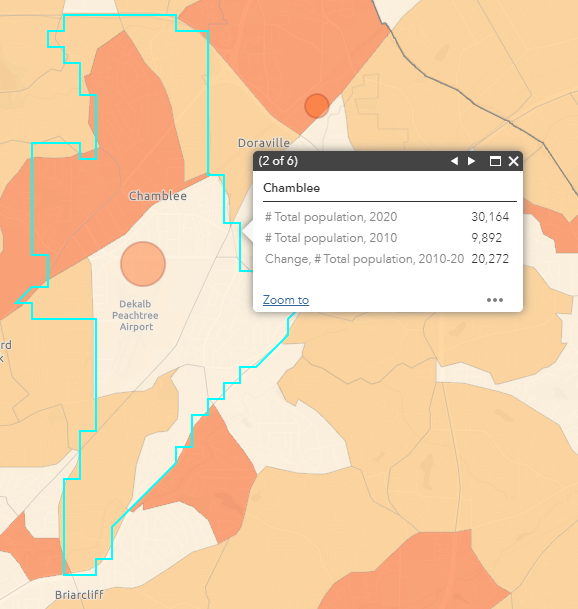
The 2020 Census data is out, and it confirms trends we’ve seen on the horizon for a while now: Atlanta is becoming more diverse, and the diversity is more widespread than ever before. Overall population growth, however, has slowed when compared to what we saw in the 1990s and 2000s.
An Overview of Change in the 11-County Area
The current Census shows that the 11 counties that make up ARC’s region collectively grew by 16 percent, from 4.3 million people to 5 million people. The group that grew most was Non-Hispanic Other races, which went from 2.3 percent of residents (97,858 people) in 2010 to 4.6 percent (228,568 people) in 2020. The group that saw a decrease in its share of the population was Non-Hispanic White, which saw a 7.1 point decrease, from 45.6 percent (1,951,981) to 38.5 percent (1,912,447) during the past decade.
Change at the Tract Level
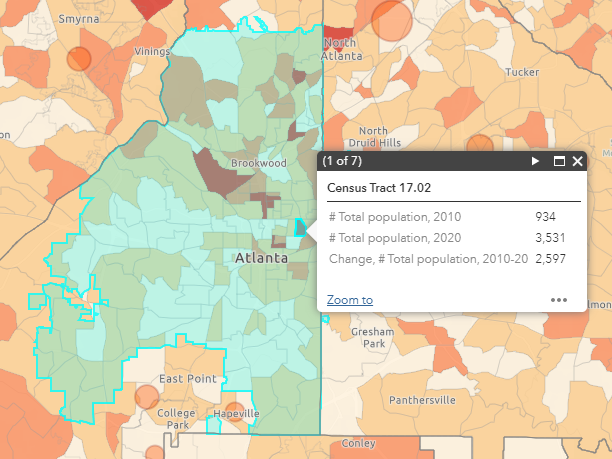
Of the 1,248 census tracts that make up the 11-county region, 88.4 percent of them experienced a population increase, and the tract with the greatest population increase was Census Tract 17.02 in the City of Atlanta’s Old Fourth Ward area. Here, the population grew by 278.05 percent, going from 934 people in 2010 to 3,531 people in 2020. (See Map 1, top right)
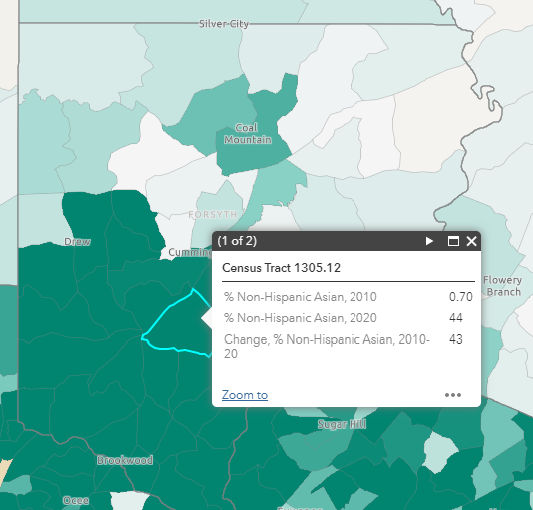
The area where we saw the greatest increase in any race/ethnicity group is Forsyth County’s Census Tract 1305.12, in which the Non-Hispanic Asian population grew by 43 points, from 0.7 percent of the tract’s total 2010 population (2,058 people) to 43.7 percent of the tract’s total 2020 population (4,383). (See Map 2, right).
Change at the City Level
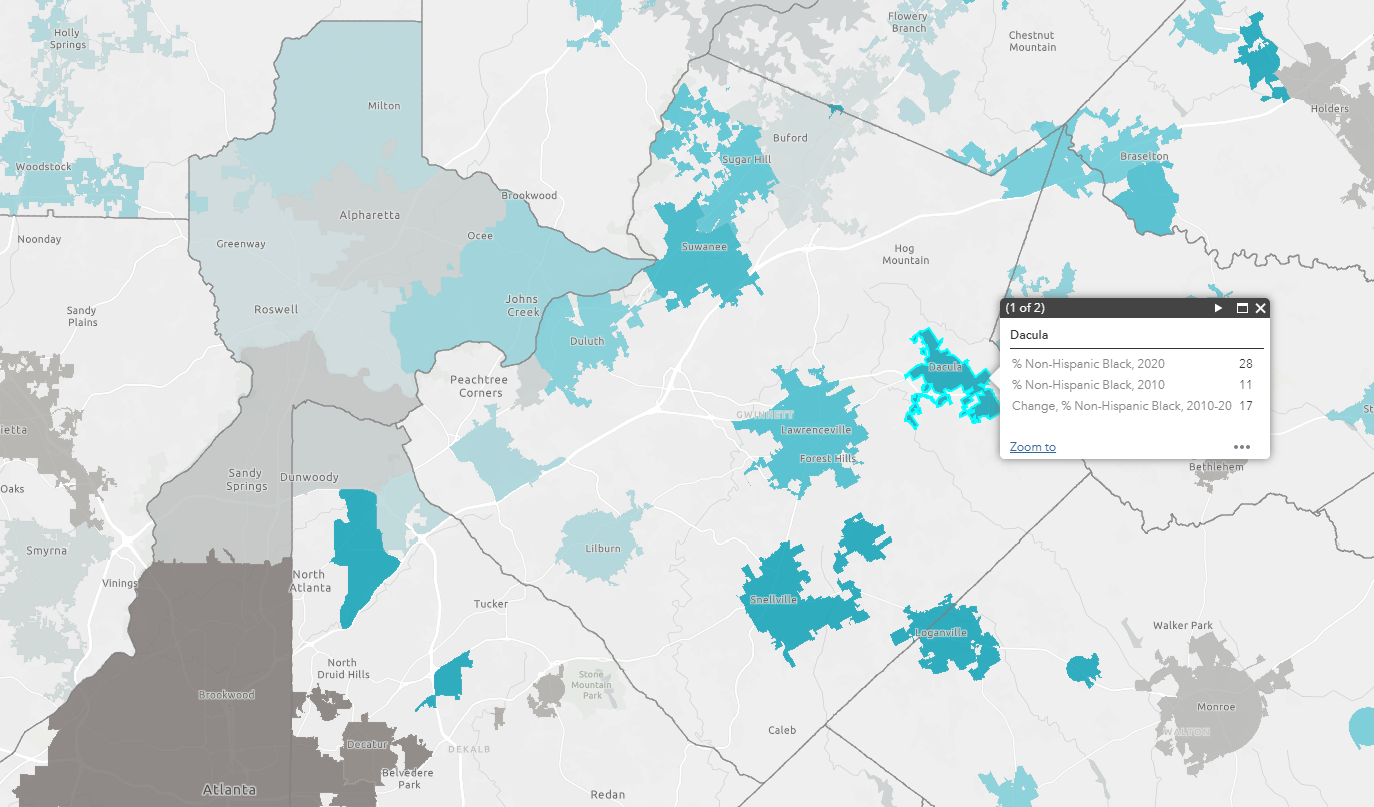
At the city level, Dacula saw the greatest change in any one racial grouping, with its Non-Hispanic Black population growing from 11.1 percent in 2010 (total city population of 4,442) to 27.9 percent in 2020 (total city population of 6,882), a 16.8 percentage point increase.
Explore More
Want to know more about demographic change statewide? The interactive map below offers all the latest information from the 2020 Census. You can also click here to open it in a separate browser.


