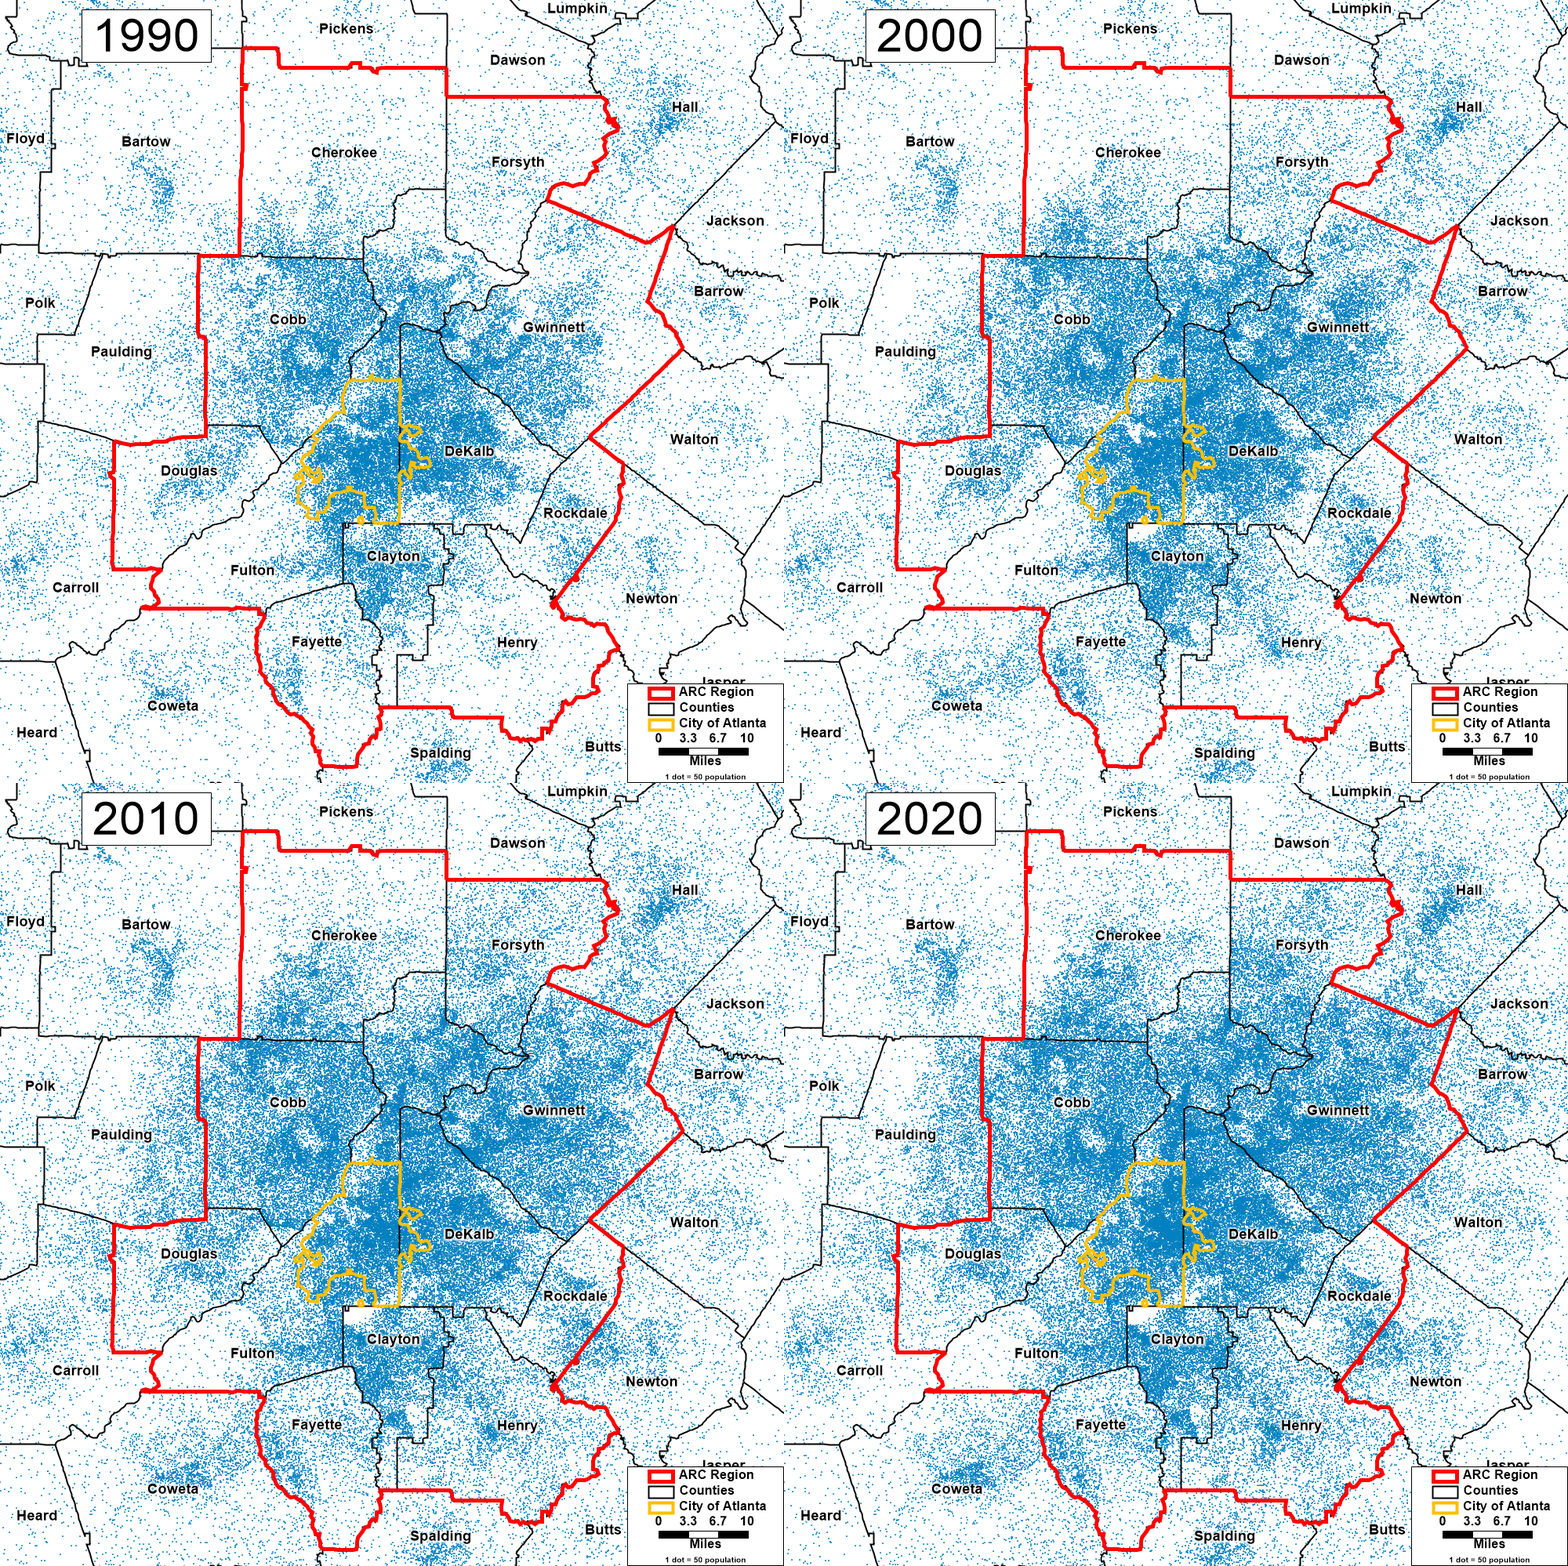
As anyone who has lived here (or attempted to navigate the Perimeter in rush hour) knows, Metro Atlanta’s big story is growth. Georgia’s population has increased more rapidly than the United States as a whole, with its share of Congressional Districts increasing from 11 in 1990 (including the one earned via the 1990 Census) to 14 today. And the Atlanta region has been the major driver of this growth. Over the past 30 years, the population of the eleven counties comprising the Atlanta Regional Commission area has roughly doubled: It grew 94% from just over 2.5 million to nearly 5 million between 1990 and 2020.
Outer ring counties have shown the greatest growth: Forsyth and Henry have led the way with population increases of 470% and 310% respectively during this timeframe. But even the City of Atlanta has shown significant population growth since 1990. Part of that is thanks to annexation, but even holding Atlanta constant to its current boundaries, the city has grown almost 25%, from about 400,000 to just under 500,000.
The animation accompanying this post is a dot density map: Each dot represents 50 people, with dots randomly scattered within the Census tract of residence. In this way, the map shows not just which counties have grown but also where within the county that growth has occurred over time. For example, we see how areas of higher population density have spread north and east through Gwinnett County with each decade.


