There’s been a lot of talk about crime in Atlanta of late; some perceive that it is spiraling “out of control”. Indeed, a plurality of respondents to our most recent Metro Atlanta Speaks survey named crime as the biggest problem facing the region. But what do the crime data themselves have to say?
The Atlanta Police Department’s COBRA dataset is publicly available and has incident-level crime data for the last 14 years. Here’s what the data show:
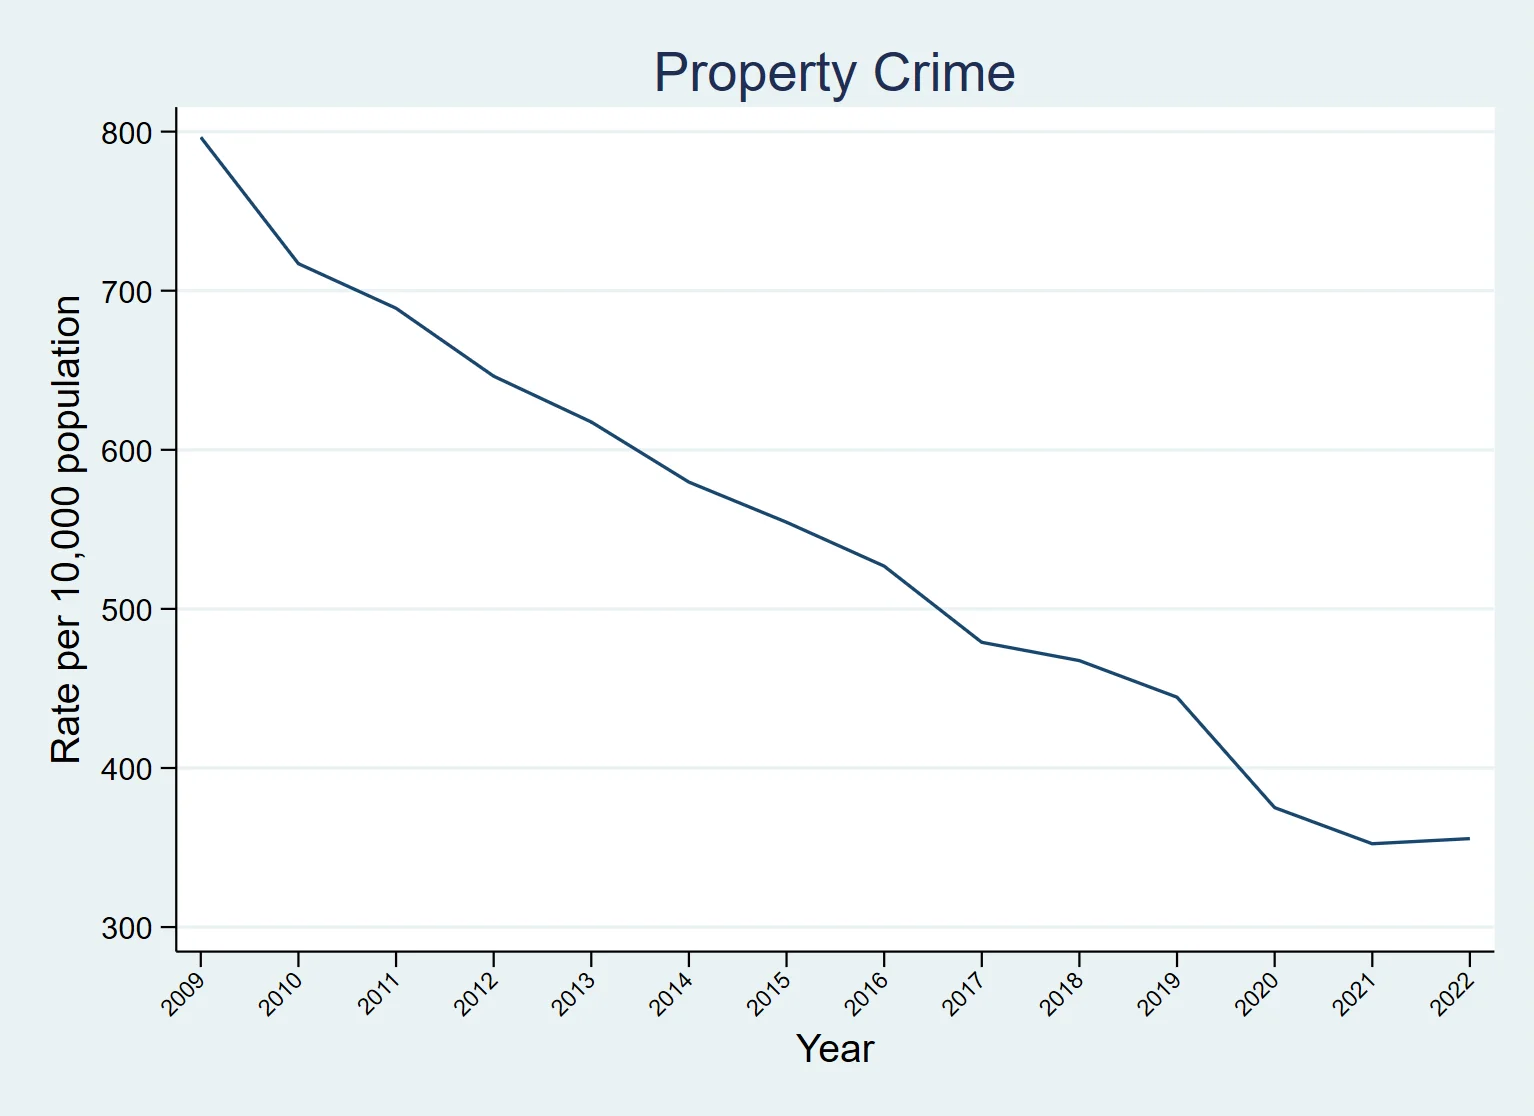
- The citywide property crime rate was basically flat from 2021-22, and it remains considerably lower than pre-pandemic levels.
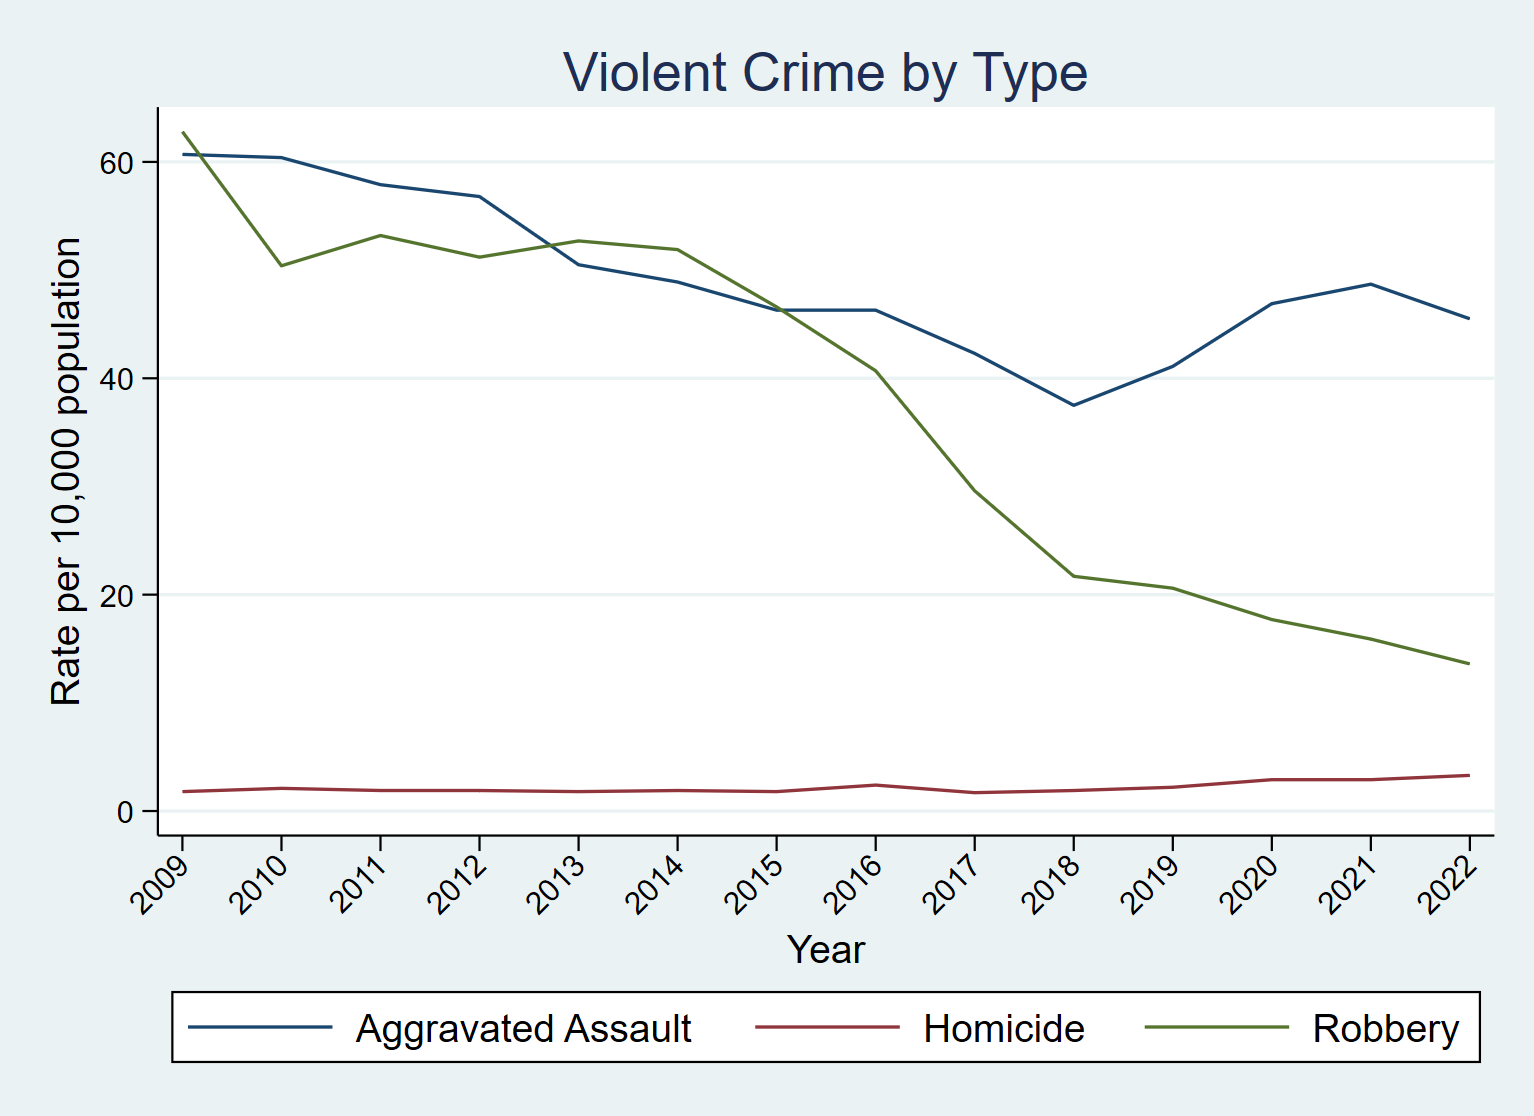
- After a 3-year uptick in 2019-21, the citywide violent crime rate for 2022 returned to near the historic low set in 2018.
- The news is not all good, however, as the city’s homicide rate continues to creep up.
- The three northernmost NPUs (A, B, and C) continue to enjoy the lowest crime rates in the city and outperformed the rest of the city in terms of declines in both violent and property crime between 2021 and 2022.
- The homicide rate for the three northernmost NPUs bucked the citywide trend, decreasing significantly between 2021 and 2022.
Let’s look at each of these points in more depth.
Property Crime
The COBRA data allows us to look at three types of property crime: burglary, larceny, and auto theft. Taken as a group, we see that the property crime rate is practically flat, going from 352.4 crimes per 10,000 population in 2021 to 355.6 in 2022—an increase of less than 1%. The property crime rate was lower in 2022 than in any year prior, going back to 2009.
Figure 1: Historic Trend in Overall Property Crime, City of Atlanta (Source: COBRA database, ARC RAD)

If we break those crimes down by type, we see in Figure 2 that larceny rates declined a bit, while burglary and auto theft are slightly up.
Figure 2: Property Crime by Type Over Time, City of Atlanta (Source: COBRA database, ARC RAD)

Property crime has been trending down across all 25 of Atlanta’s NPUs over the 2009-2022 period, as seen below on Figure 3. However, some NPUs on the southside have seen small increases from their historic lows. The three northernmost NPUs, on the other hand, outperformed the rest of the city. They saw a 13% drop in the property crime rate between 2021 and 2022, from 255.4 incidents per 10,000 population to 221.4 per 10,000.
Figure 3: Property Crime by NPU (Time Trend), City of Atlanta (Source: COBRA database, ARC RAD)

Violent Crime
The COBRA data reports three types of violent crime: homicide, aggravated assault, and robbery. As mentioned in last year’s blog post, we saw a worrisome uptick in violent crime 2019 forward after a steady decline over the period 2009-18. But in 2022, Figure 4 illustrates that the citywide violent crime rate dropped over 7% year-over-year from 67.5 incidents per 10,000 population to 62.4 per 10,000, bested only by the historic low set in 2018.
Figure 4: Historic Trend in Violent Crime, City of Atlanta (Source: COBRA database, ARC RAD)

Looking at violent crime by type, in Figure 5 below, we see that the increase in violent crime experienced over 2019-21 was driven primarily by an increase in aggravated assault rates, and that those declined in 2022 for the first time since 2018. Robbery rates, which have been in steady decline since 2014, continued to fall.
Figure 5: Violent Crime by Type Over Time, City of Atlanta (Source: COBRA database, ARC RAD)

In terms of geography (Figure 6), a few NPUs (K, L, R, and P) saw violent crime increase despite the improved numbers citywide. But taken as a group, the three northernmost NPUs did better than the citywide trend, with a decline in the violent crime rate of nearly 12%.
Figure 6: Violent Crime by NPU (Time Trend), City of Atlanta (Source: COBRA database, ARC RAD)

Homicide
Despite the positive trend for violent crime overall, the citywide homicide rate continues to climb. Figure 7 reveals an apparent leveling off between 2020 and 2021, but the homicide rate climbed again in 2022 to 3.3 homicides per 10,000 population—the highest level since 2009.
Figure 7: Historic Trend in Homicides, City of Atlanta (Source: COBRA database, ARC RAD)

NPU A experienced its first homicide since 2018, a crime that shook neighborhoods in the northeastern most corner of the city. Taken as a group, however, the three northernmost NPUs bucked the citywide trend: the homicide rate dropped over 46% year-on-year. NPUs H, L, Y, and Z saw the largest increases in homicide rates.
Figure 8: Homicides by NPU (Time Trend), City of Atlanta (Source: COBRA database, ARC RAD)

Want to explore further on your own? We have prepared a visualization that permits examination of crime rates over time by NPU and by type. (Atlanta Crime x NPU | Tableau Public)

