
The Atlanta Journal-Constitution[1] recently reported that Atlanta experienced a 21 percent drop in homicides in 2023. Yet, the results of this year’s Metro Atlanta Speaks Survey (MAS) continued to find that crime was metro residents’ #1 concern, including in the city itself.[2] Do the actual crime data back up these perceptions (from MAS)?
To answer this question, it is helpful to put Atlanta crime in historical perspective; we can accomplish this using data provided through the Atlanta Police Department’s (APD) Open Data Portal.[3]
Figure 1 below shows violent crime rates [3] for the last 15 years. After a steady decline in violent crime rates from 2009 to 2018, violent crime actually started to rebound the year before the pandemic began. However, even this with increase, the violent crime rate never exceeded its 2017 level and has since dropped to a new historic low in 2023.
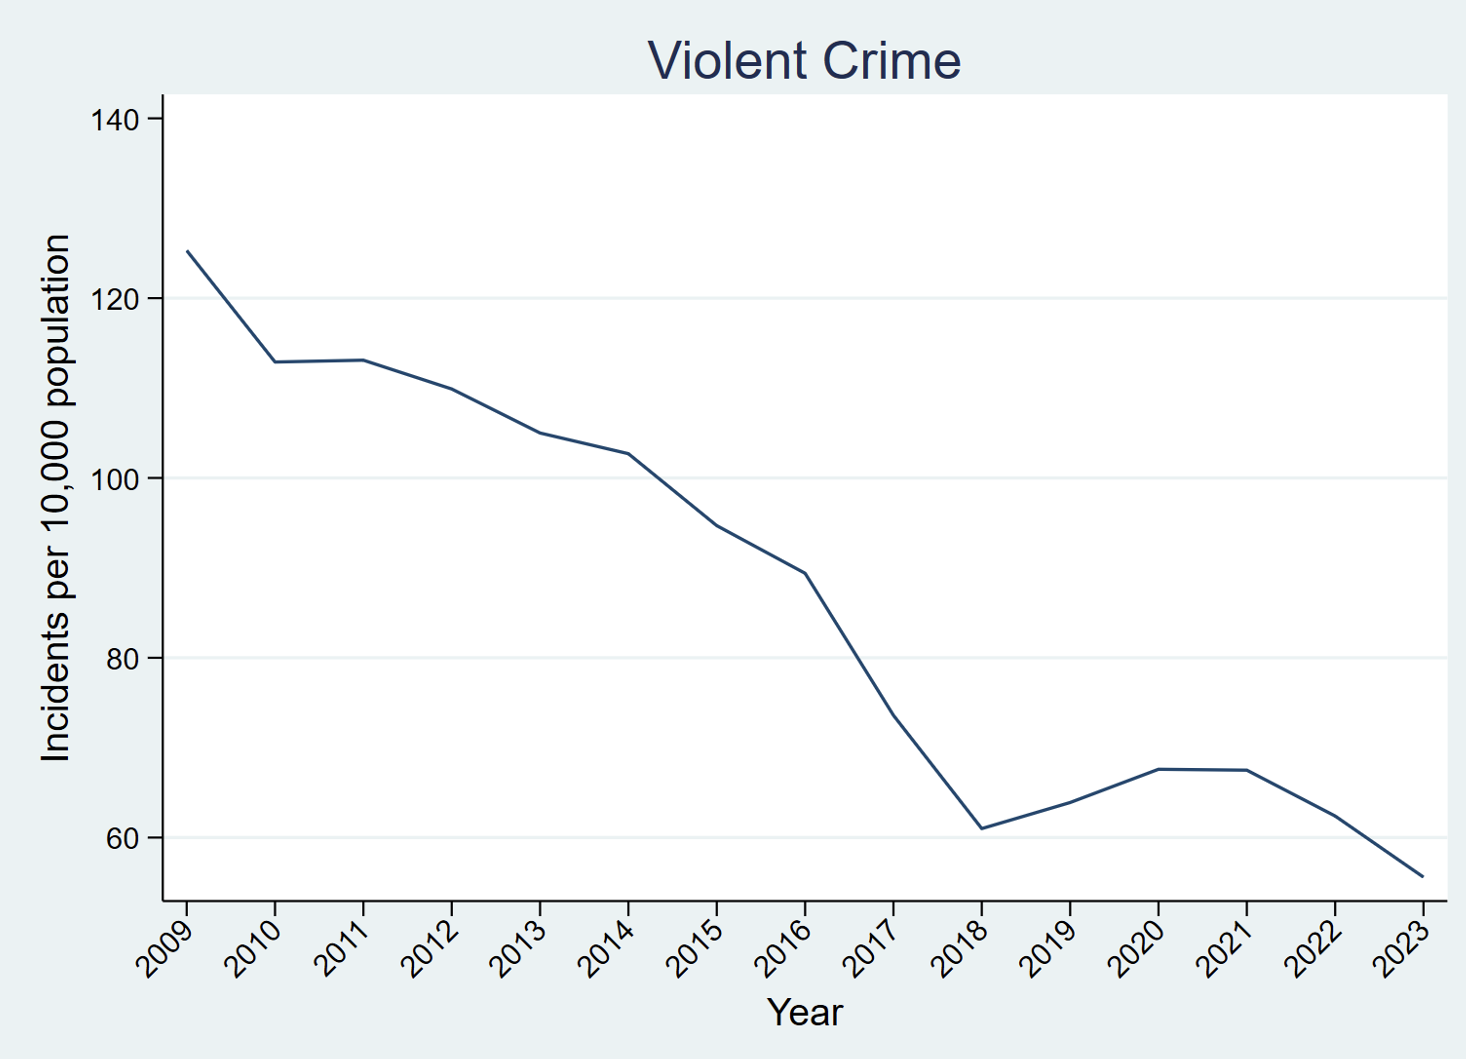
Figure 1: Historic Trend in Violent Crime, City of Atlanta (Source: COBRA database, ARC RAD)
Figure 2, which displays violent crime incident rates by Atlanta Neighborhood Planning Unit (NPU), shows that violent crime rates are at or near their historic lows in almost every NPU. Figure 2 also shows that NPUs A, B, and C, the areas in the northern part of the City that might have seceded if the General Assembly had approved the proposed referendum last year, remain the safest parts of the city.
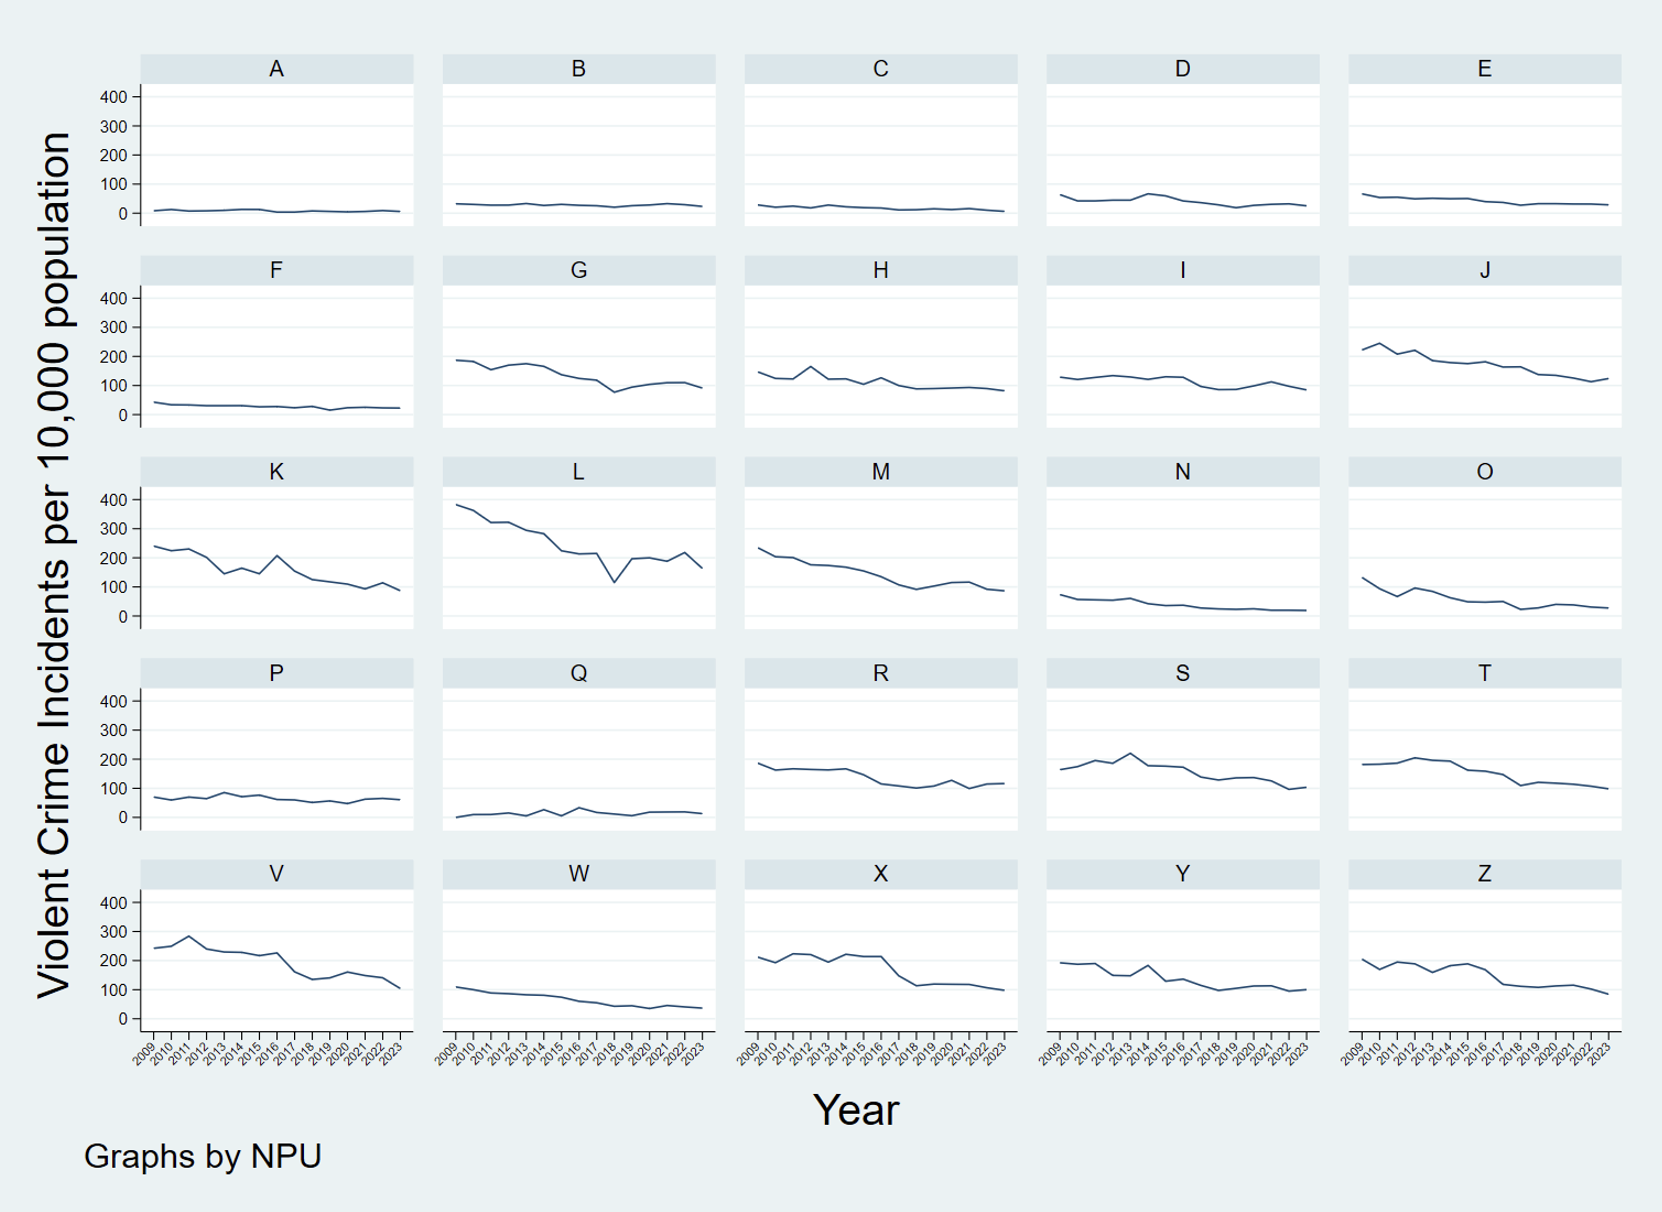
Figure 2: Violent Crime by NPU (Time Trend), City of Atlanta (Source: COBRA database, ARC RAD)
Turning to homicides, the news is, of course, good. Figure 3, which follows, shows that the rate of homicide incidents dropped sharply year over year[3], to a level we have not seen since before the start of the pandemic.
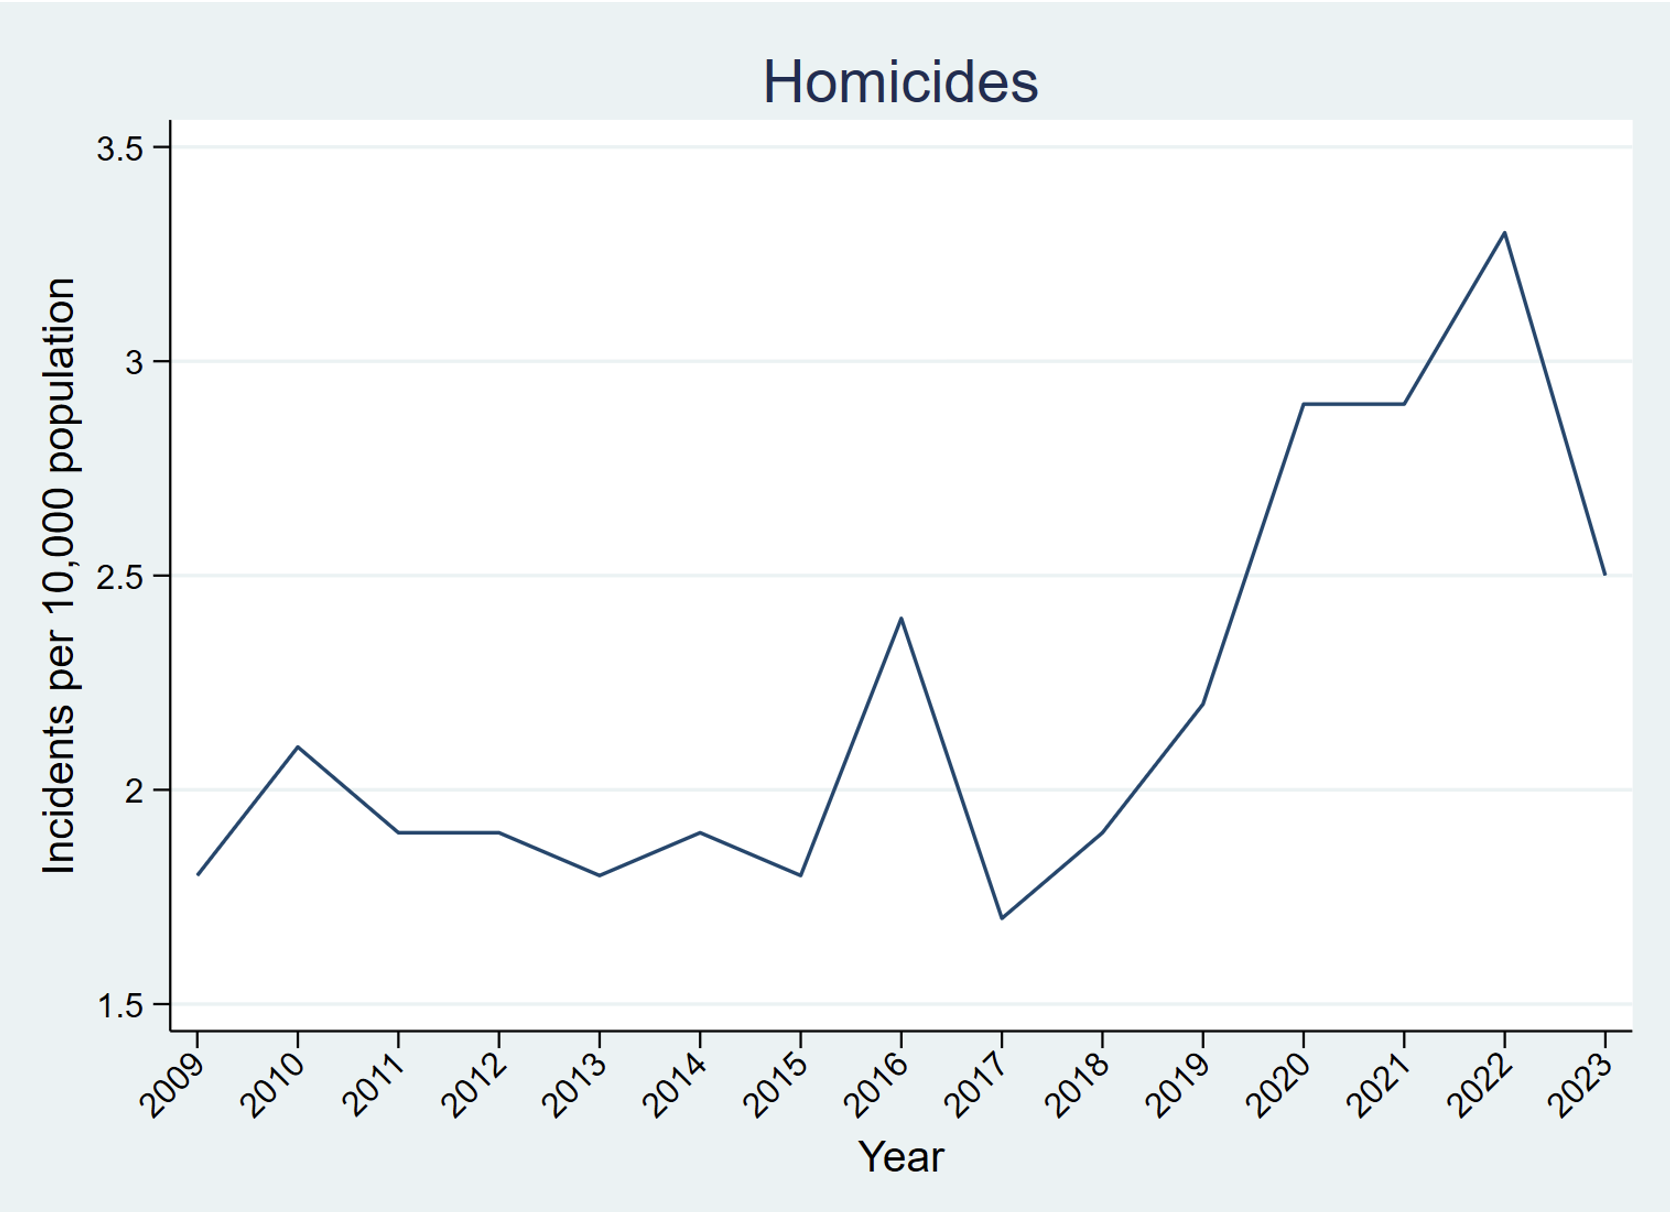
Figure 3: Historic Trend in Homicides, City of Atlanta (Source: COBRA database, ARC RAD)
We observe drops in the homicide incident rate in 19 of Atlanta’s 25 NPUs, as shown in figure 4. The homicide rate rose in five NPUs: H, P, S, V, and X. It stayed constant in NPU Q, which had zero homicides in both 2022 and 2023.
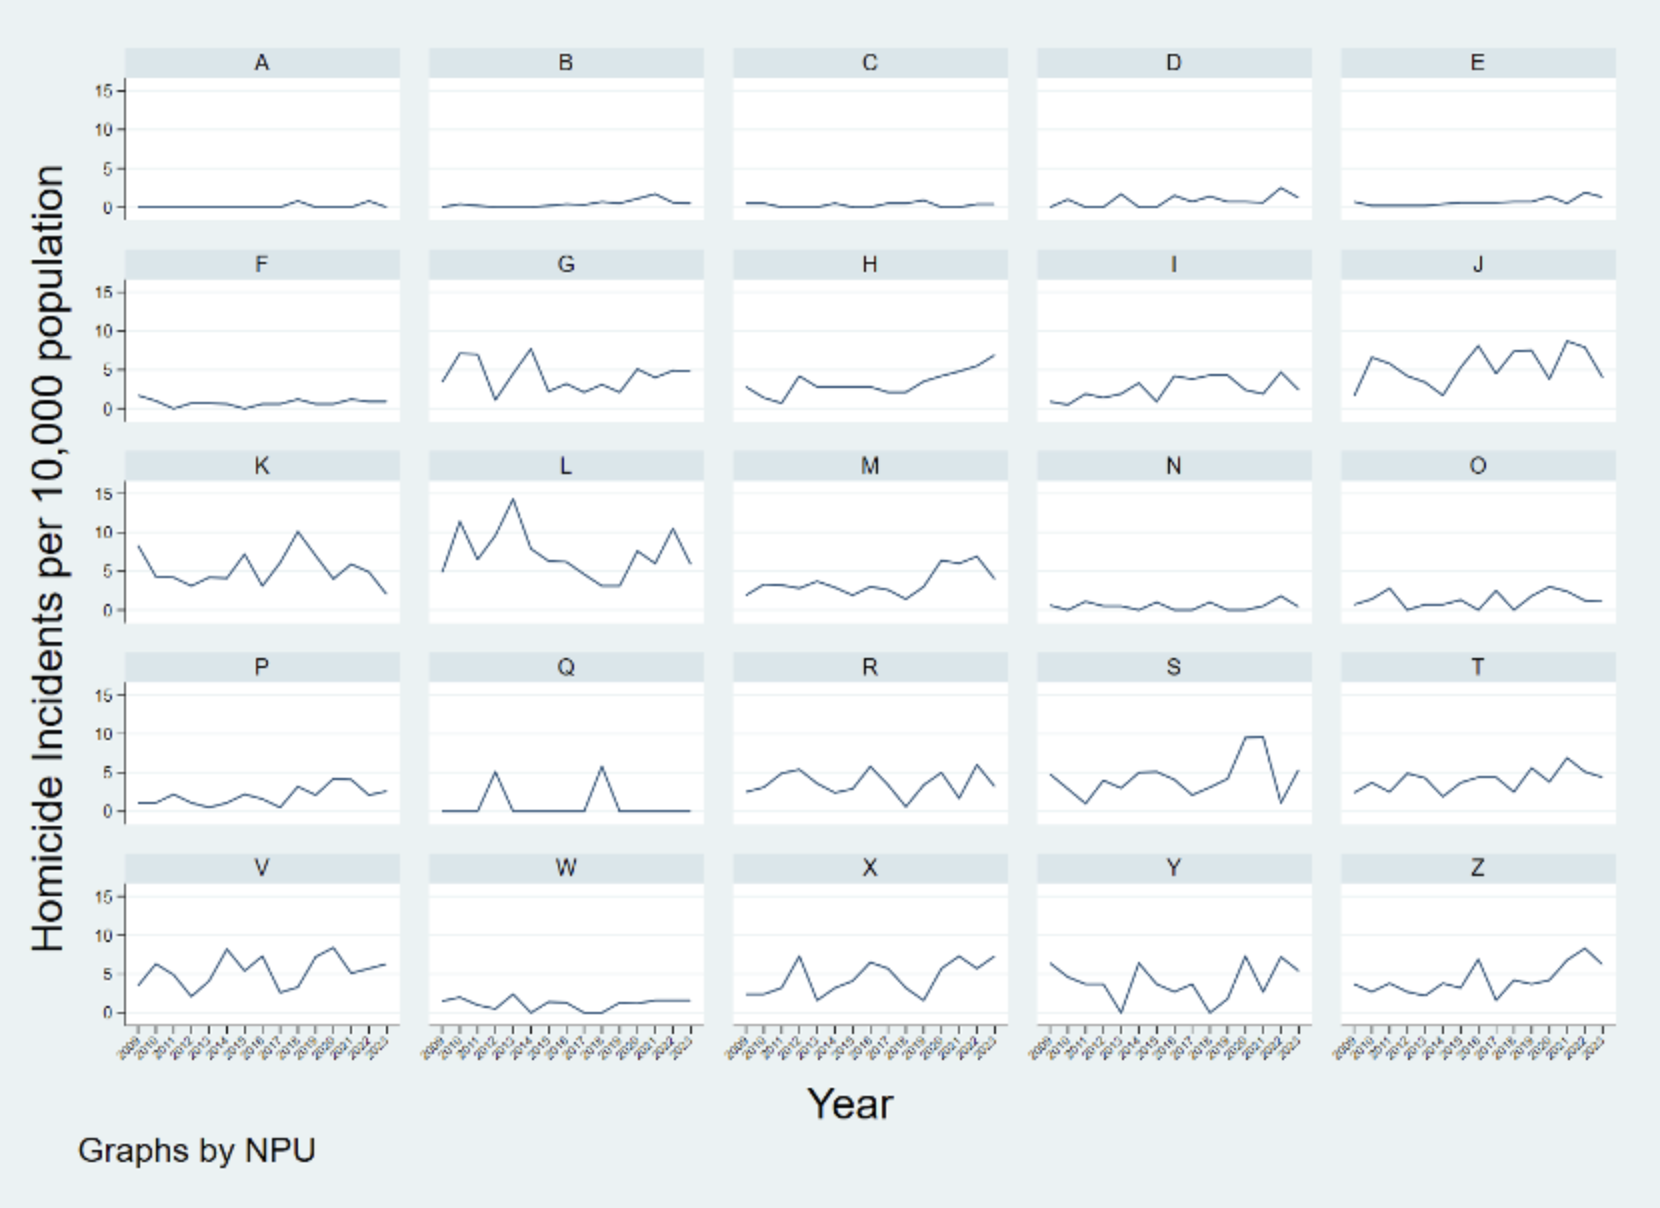
Figure 4: Homicides by NPU (Time Trend), City of Atlanta (Source: COBRA database, ARC RAD)
This improvement in homicide rates is largely attributable to a subsiding of pandemic-related conditions that led to the rise in homicides nationwide. But improved targeting of police resources over the last couple of years has likely helped as well. For example, NPU B had 11 homicide incidents in 2021, mostly clustered in one small area. That number was brought down to just three by 2023.
Despite the significant year-on-year decline, the homicide rate for 2023 was still higher than that observed during the 2010s, so we will need more years of data to better understand this trend. However, it is worth noting that homicides had been rising steadily in their share of total violent crime over this entire period—until 2023, when that direction reversed. In other words, while violent crimes were becoming less frequent over time, it was increasingly likely that a violent crime would turn deadly—likely a function of the type of weapon used. The share of violent crimes resulting in homicide declined in 2023 is cause for some celebration, and is a sign that police efforts to get guns off the streets may be bearing fruit. This will be a trend to watch for in 2024.
At the same time, not all crime trends were positive in 2023. Figure 5 below shows that property crime, which had been in steady decline until 2021, had a larger uptick in 2023 than in 2022.
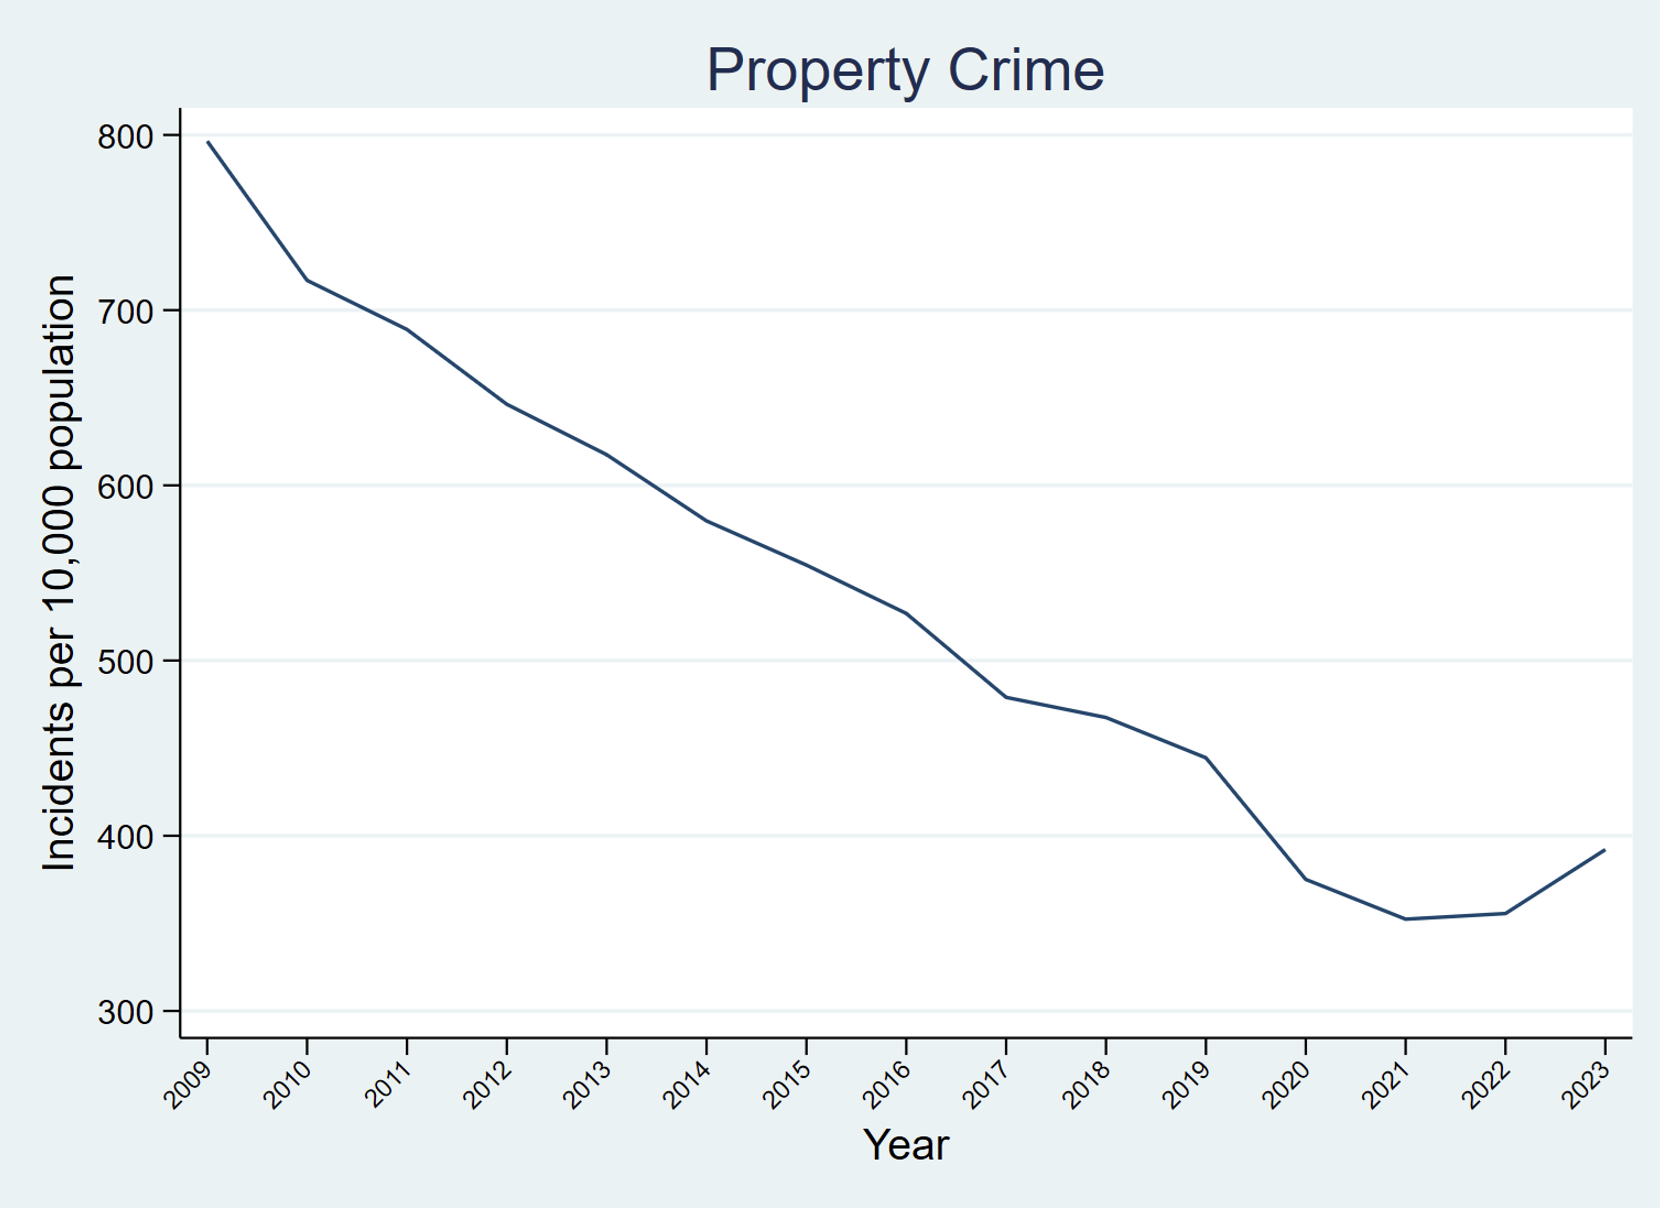
Figure 5: Historic Trend in Overall Property Crime, City of Atlanta (Source: COBRA database, ARC RAD)
Figure 6 breaks property crime down by type, and reveals that the reason for overall property crime rate increase for 2023 was a sharp rise in auto theft rates. Burglary and larceny rates were basically flat.
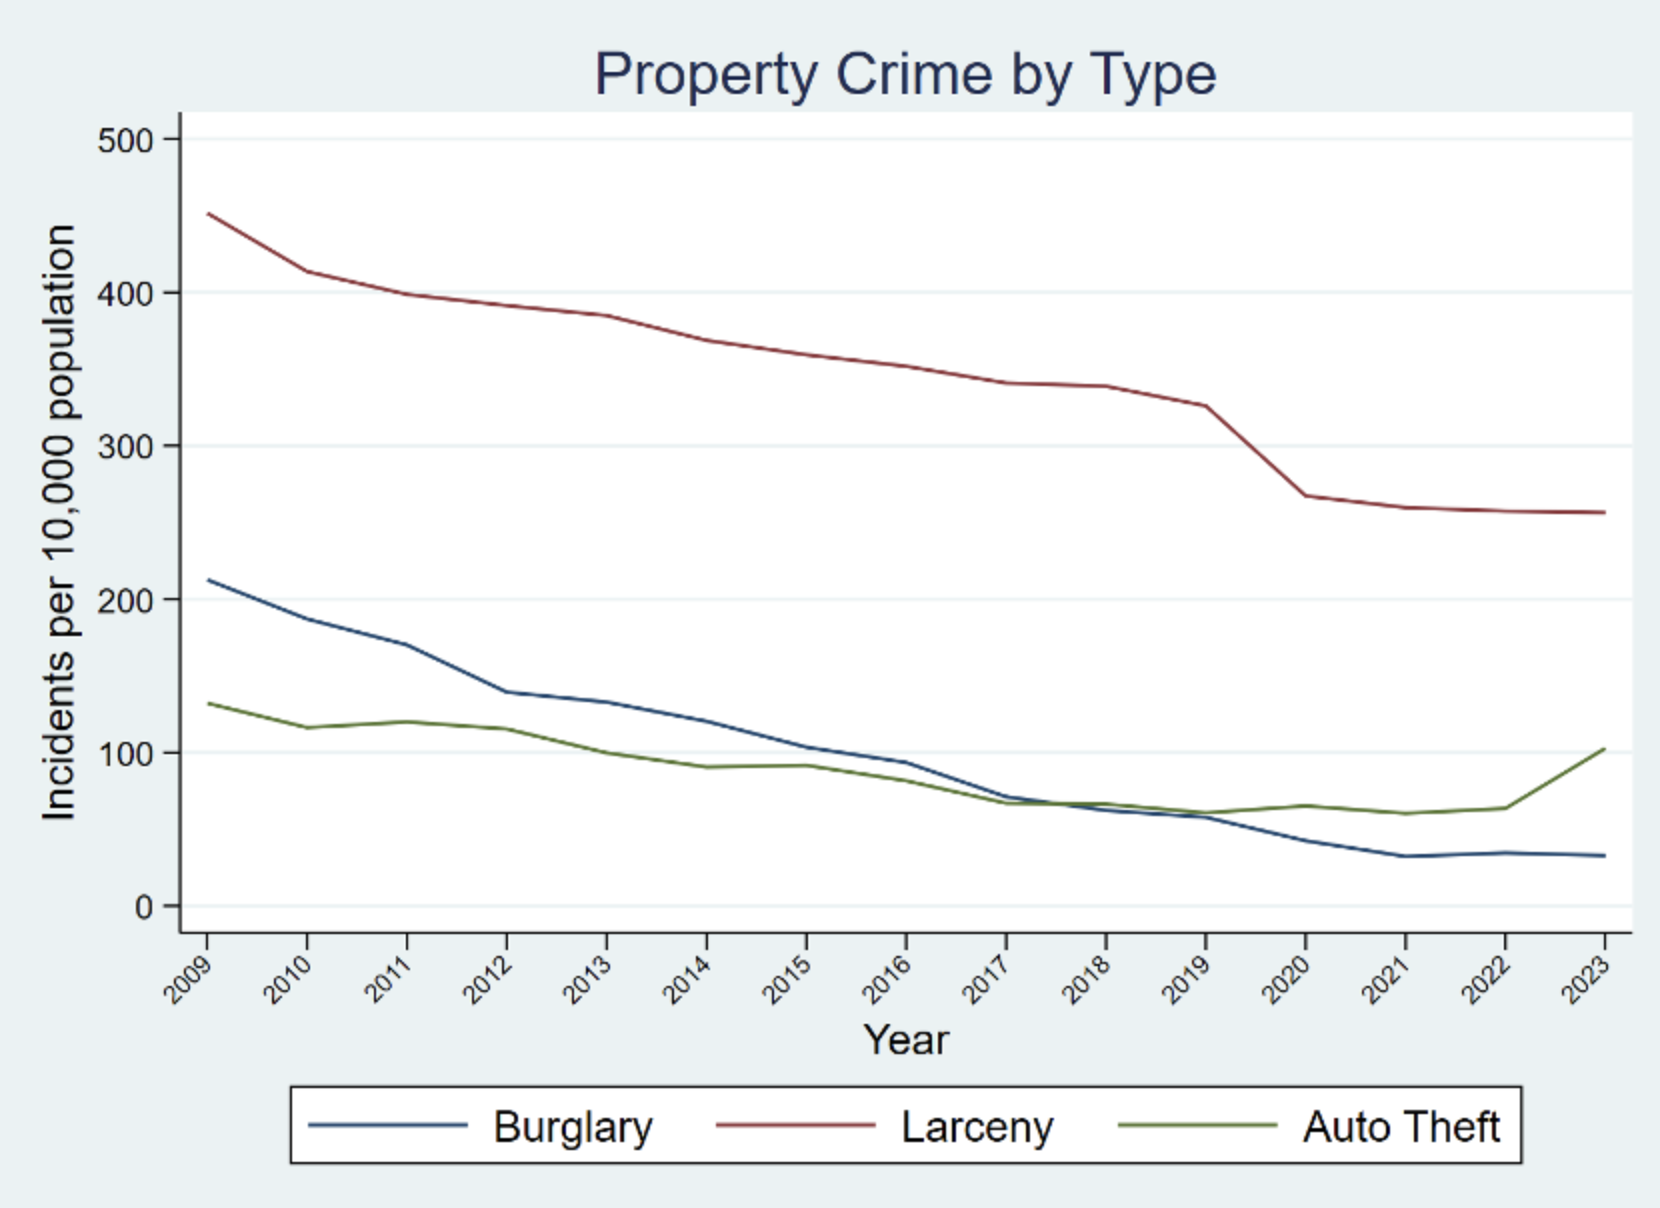
Figure 6: Property Crime by Type Over Time, City of Atlanta (Source: COBRA database, ARC RAD)
In the final analysis, most crime is down in the City of Atlanta, and that is especially true for the most serious crimes. Perceptions are currently lagging behind reality.
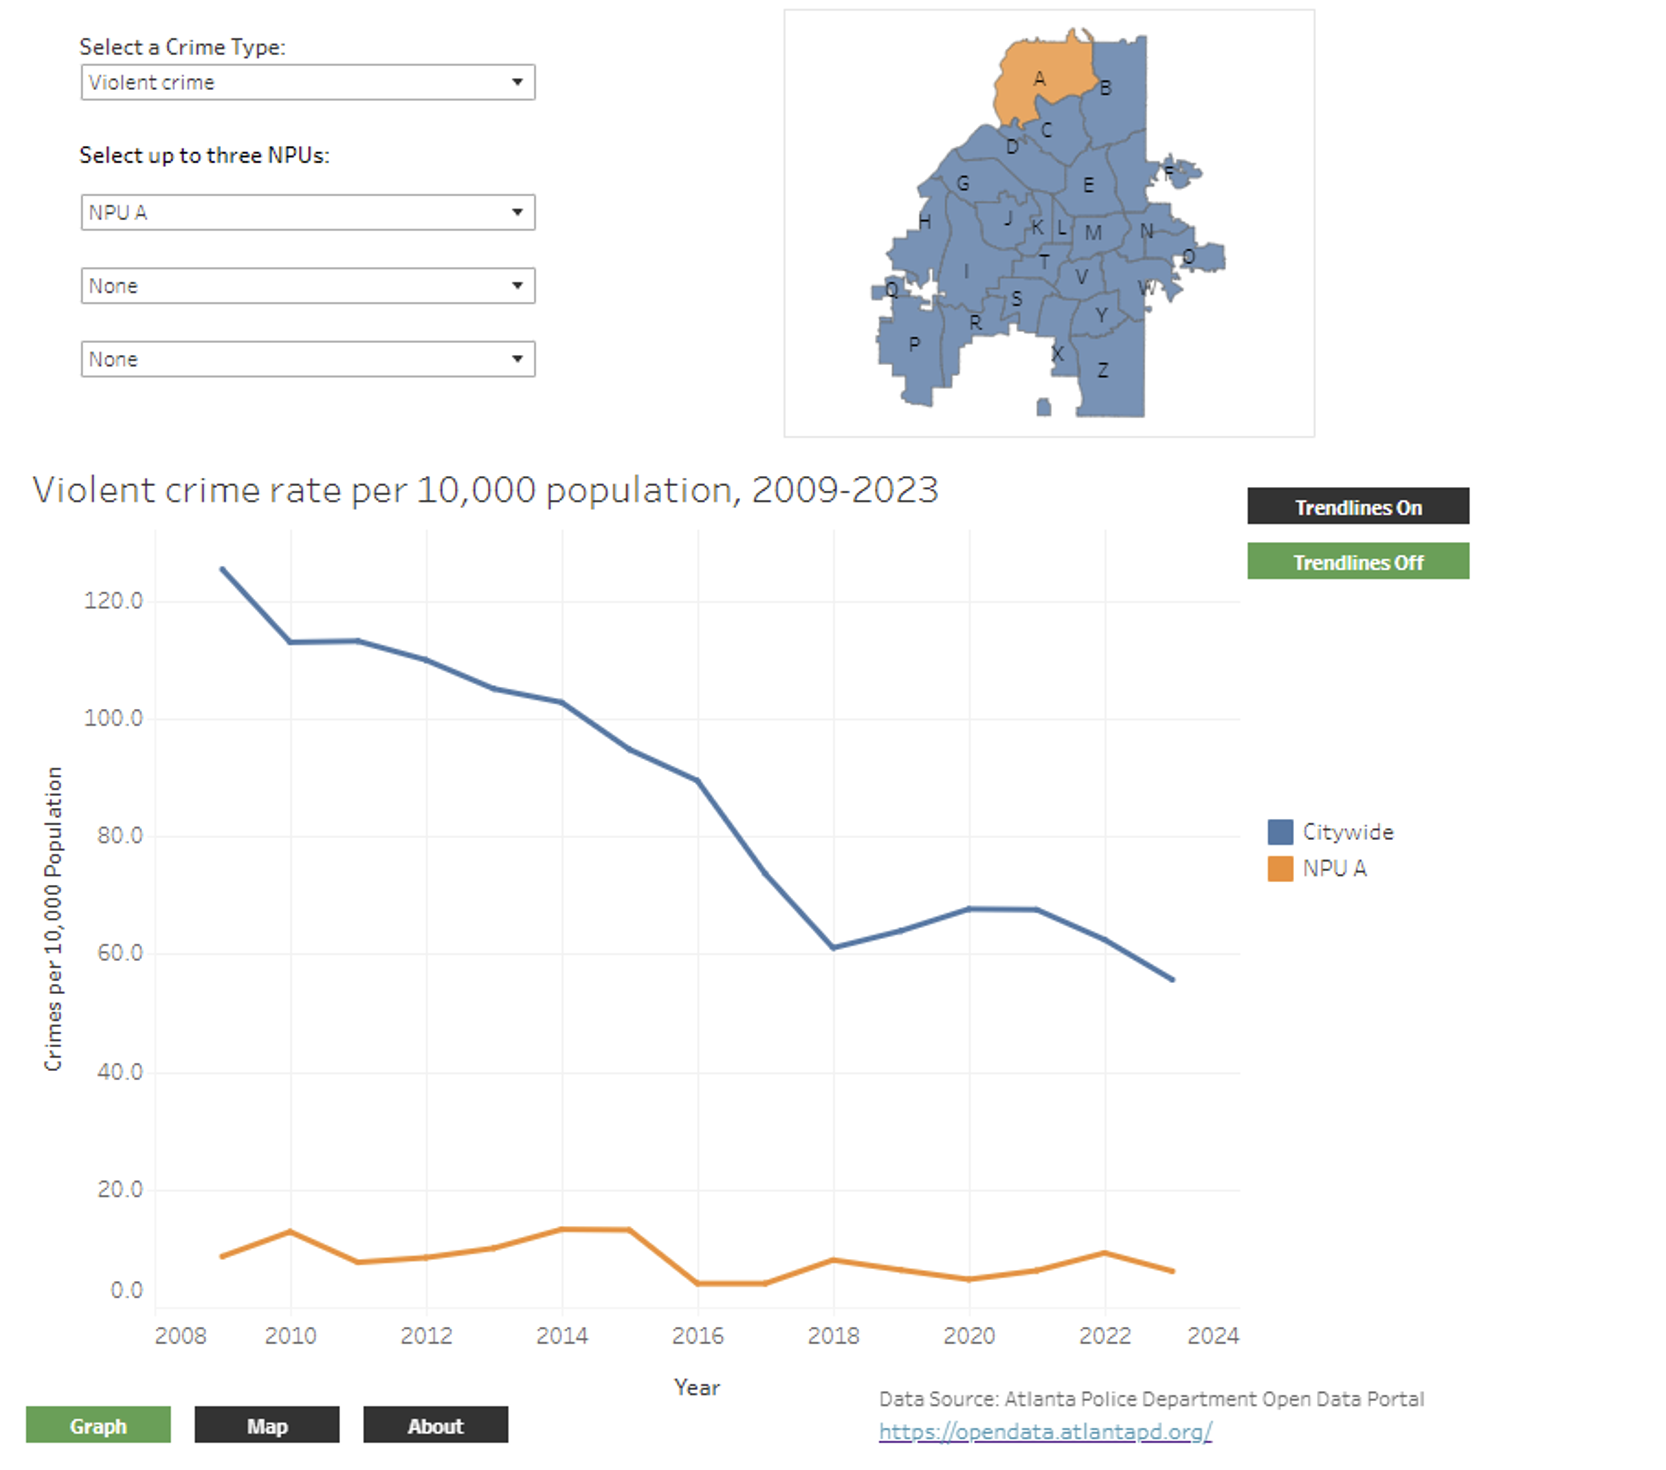
Want to explore further? Click here to access our Atlanta crime Tableau dashboard, a snapshot of which is shown below. This dashboard has been updated by NPU to include data through 2023.
Footnotes
[2] See https://33n.atlantaregional.com/data-diversions/metro-atlanta-speaks-2023-previewing-the-results
[3] Readers may notice that this is a different source than that utilized in last year’s blog post on Atlanta crime. In 2023, APD transitioned from a system where someone physically posted a new data extract every couple of weeks to one that pulls data from their crime reporting system essentially in real time. This means that you can visit https://opendata.atlantapd.org/ on any given day and access a map of all crimes reported the day before. The new system also provides data on a wider variety of crimes. Whereas the old system reported the Part I crimes of homicide, robbery, aggravated assault (collectively known as violent crimes) and burglary, larceny, and auto theft (collectively known as property crimes), the new system also reports many types of Part II crimes, such as vandalism, drug violations, simple assault, and confidence games. This increased transparency allows us to have a more complete picture of crime in the city and where it is concentrated. The Part I data provided in the new system remain compatible with the past data extracts, so we can continue to make comparisons over time.