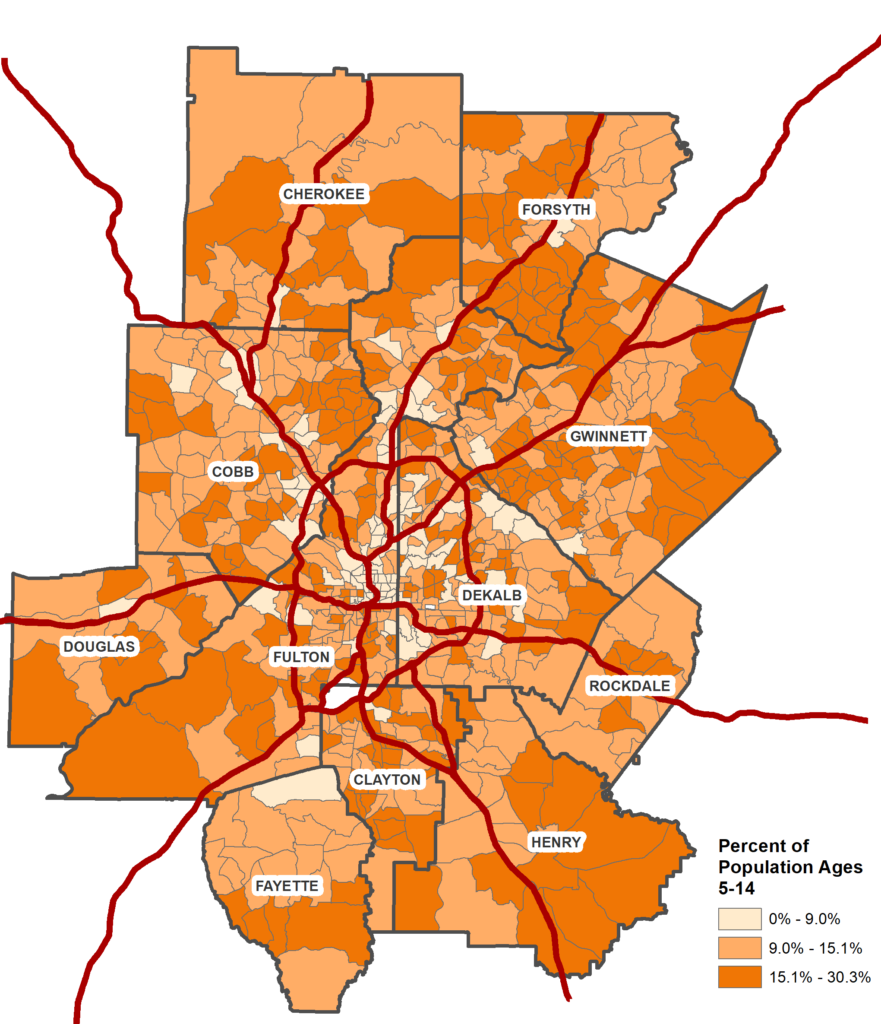
Behold! All Hallows’ Eve, otherwise known as Halloween, is almost upon us! This holiday occurs October 31 every year and has a very complex origin story. However, one way people celebrate Halloween in the United States is by trick-or-treating: A custom that involves children going door-to-door in their local neighborhoods dressed in costumes and requesting candy by chanting “Trick or treat!” The map below shows the census tracts in the Atlanta region with the highest percentages of children, suggesting areas where trick-or-treating is more likely to happen.
Children in the Atlanta Region

Data Source: American Community Survey 5-Year Estimates, 2015-2019
This tradition is so popular that “one quarter of all candy sold annually in the U.S. is purchased for Halloween.” With that economic reality in mind, what better way to figure out what neighborhoods to trick-or-treat in than to follow the money. Next up is a map of the amount of money people in the Atlanta region are expected to spend on candy and chewing gum in 2021 divided by the number of doors to knock on in a given census tract. If you’re going to visit a neighborhood to trick or treat, you’re likeliest to score the best candy in the areas shaded in the darkest purple.* Happy Halloween!
Money Spent on Candy and Gum per Occupied Housing Unit in the Atlanta Region

Data Source: ESRI BAO 2021 Model Estimates; American Community Survey 5-Year Estimates, 2015-2019
*A more serious read of the map, of course, is that it bears strong similarity to maps we’ve run that illustrate our economic and racial segregation. Here, we’re seeing that households with more disposable income have more ability to invest in Halloween treats.

