
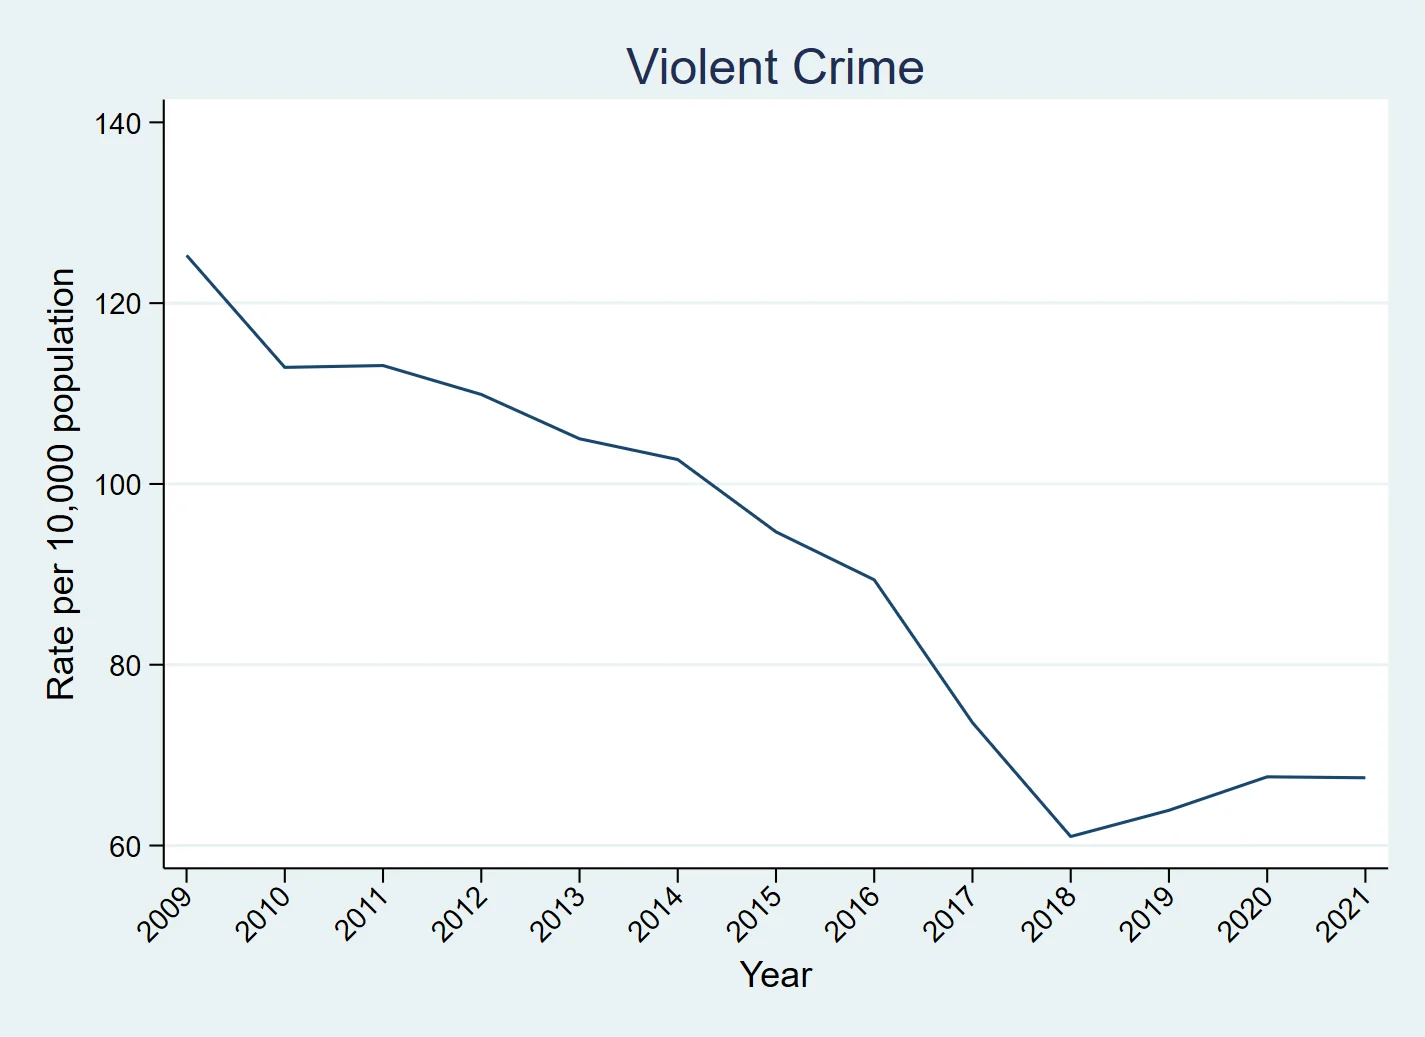
Atlanta Crime Rates in Historical Perspective (2009-2021)
Crime is a top concern across the metro. Here, we compare perceptions and reality through an examination of crime rates for the city of Atlanta since 2009. The data reveal that crime rates are near historical lows in most categories.
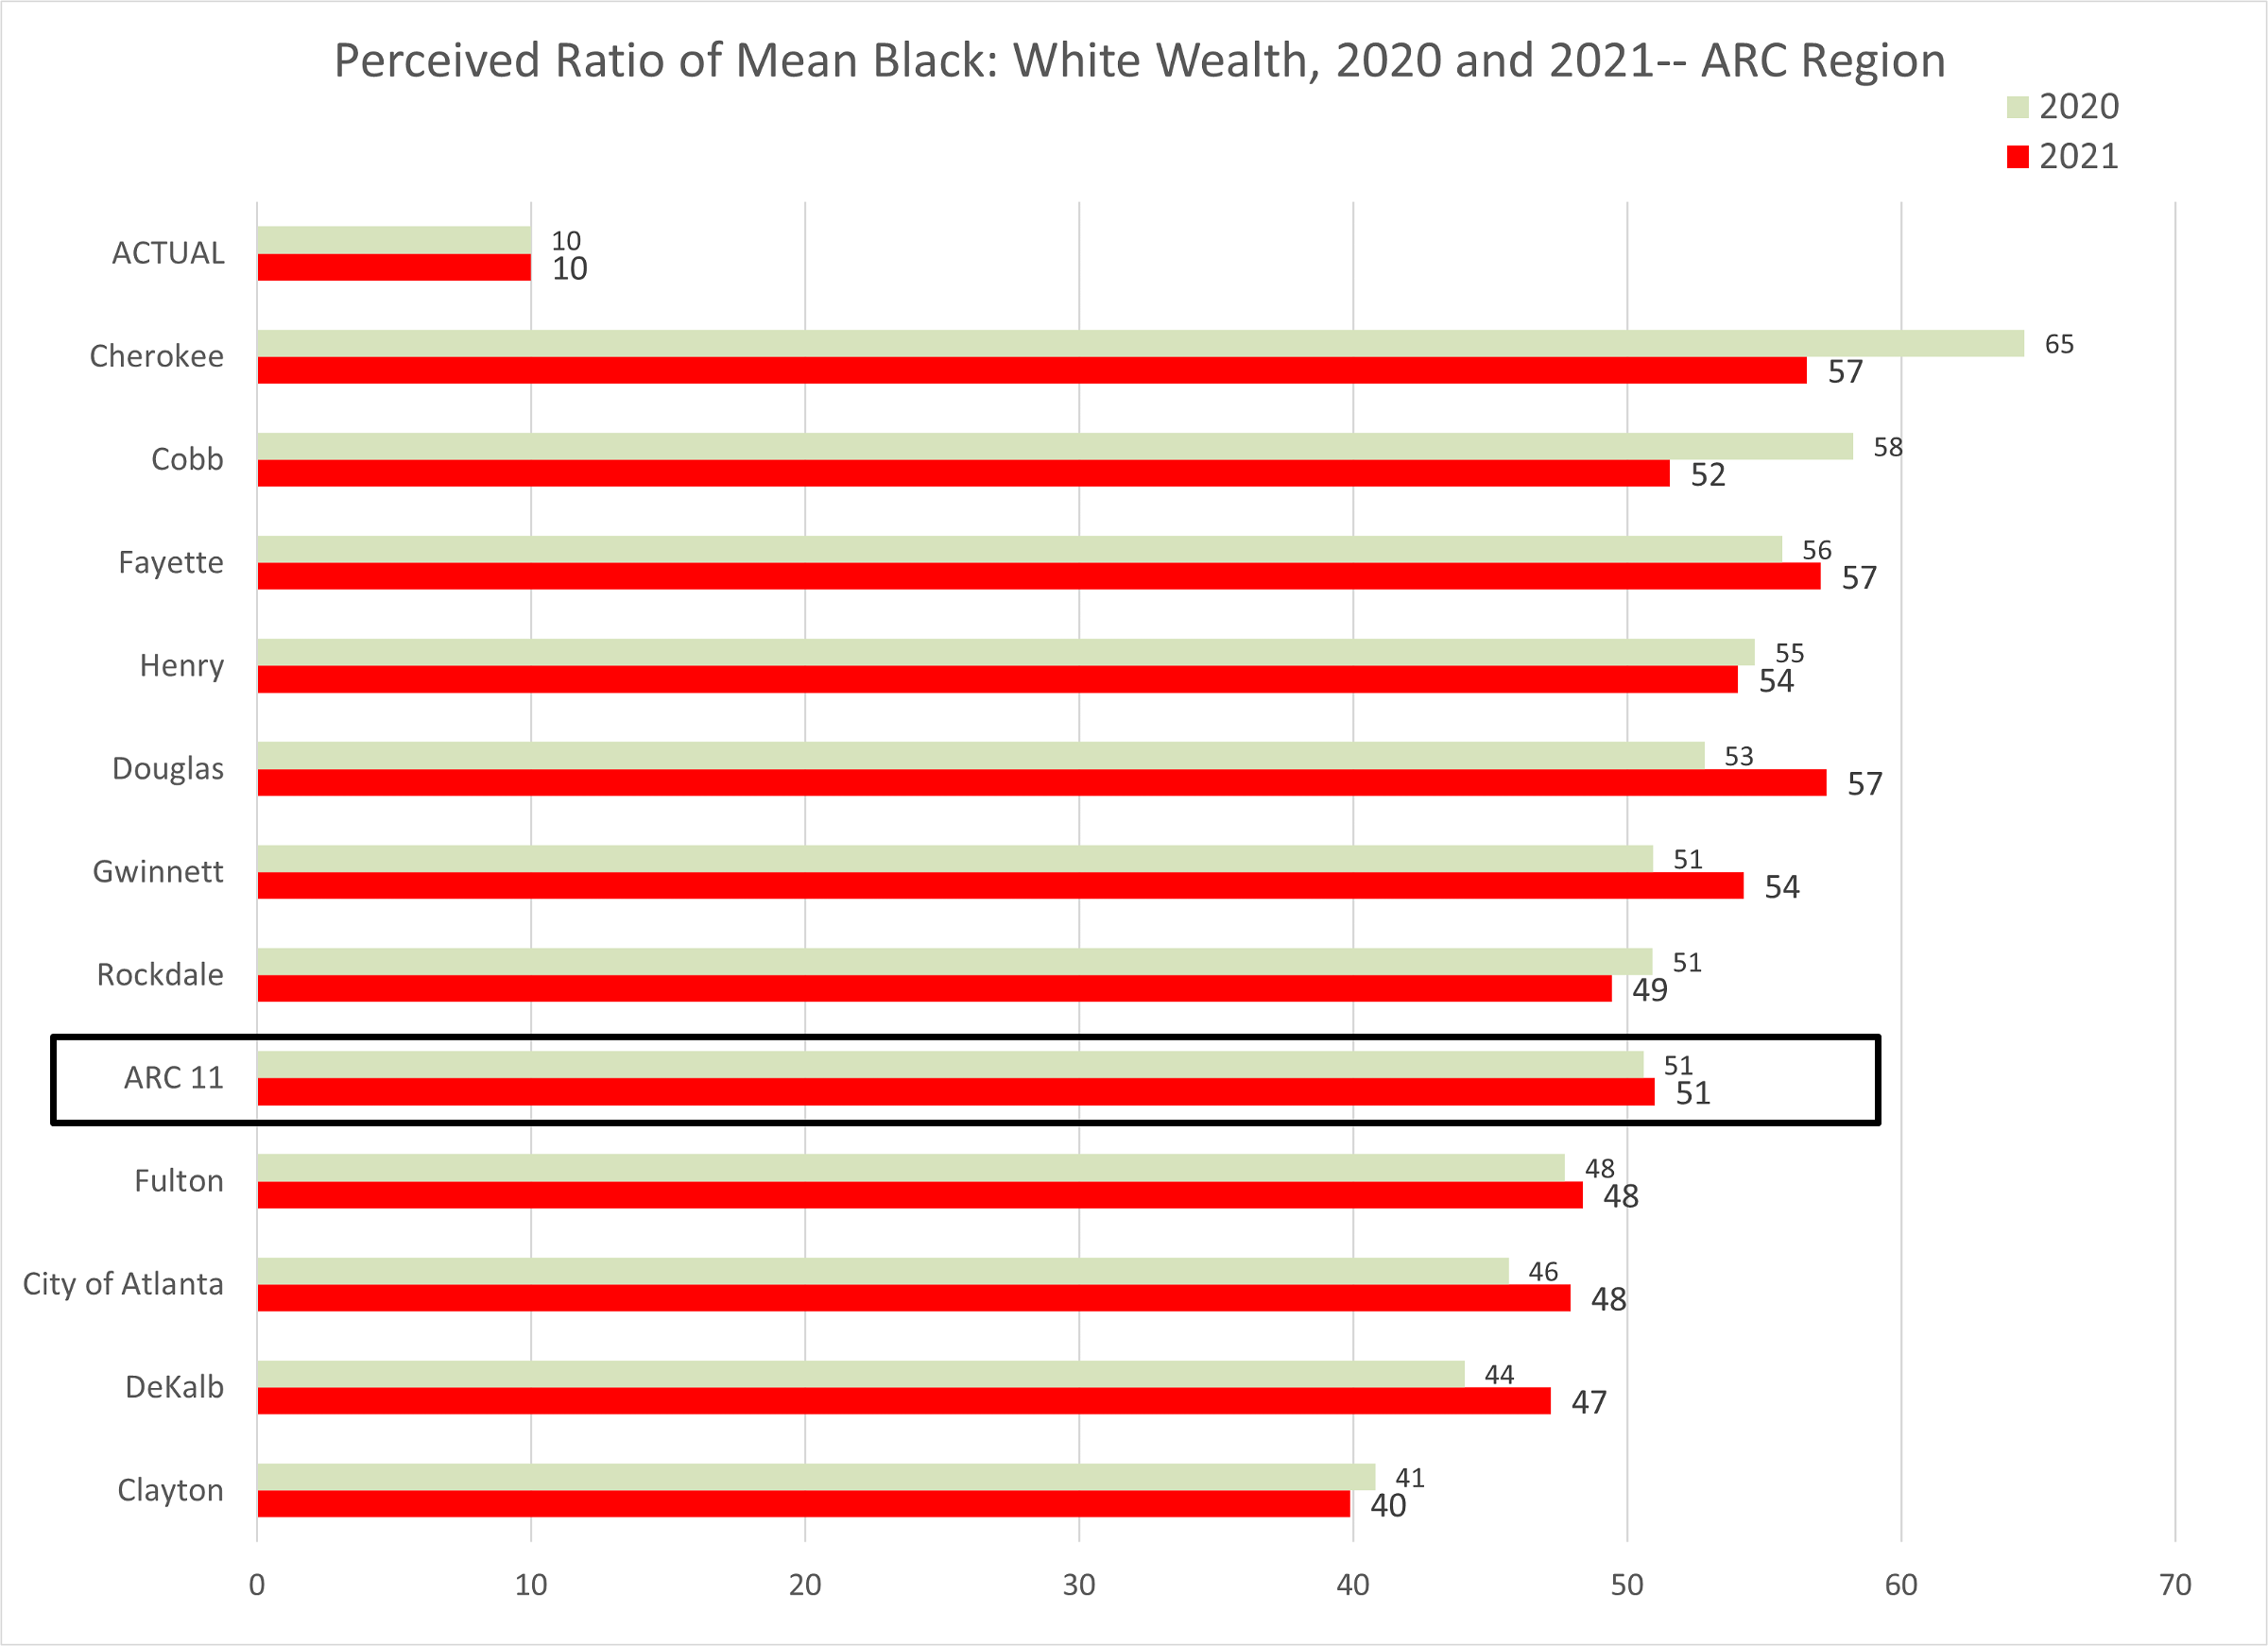
Income Inequality and Black Wealth: Opinions from Metro Atlanta Speaks
How do Atlanta residents rate the importance of enhanced income equality to our economy, and, following on, what seems to be their current knowledge base about the size of the highly related racial wealth gap?
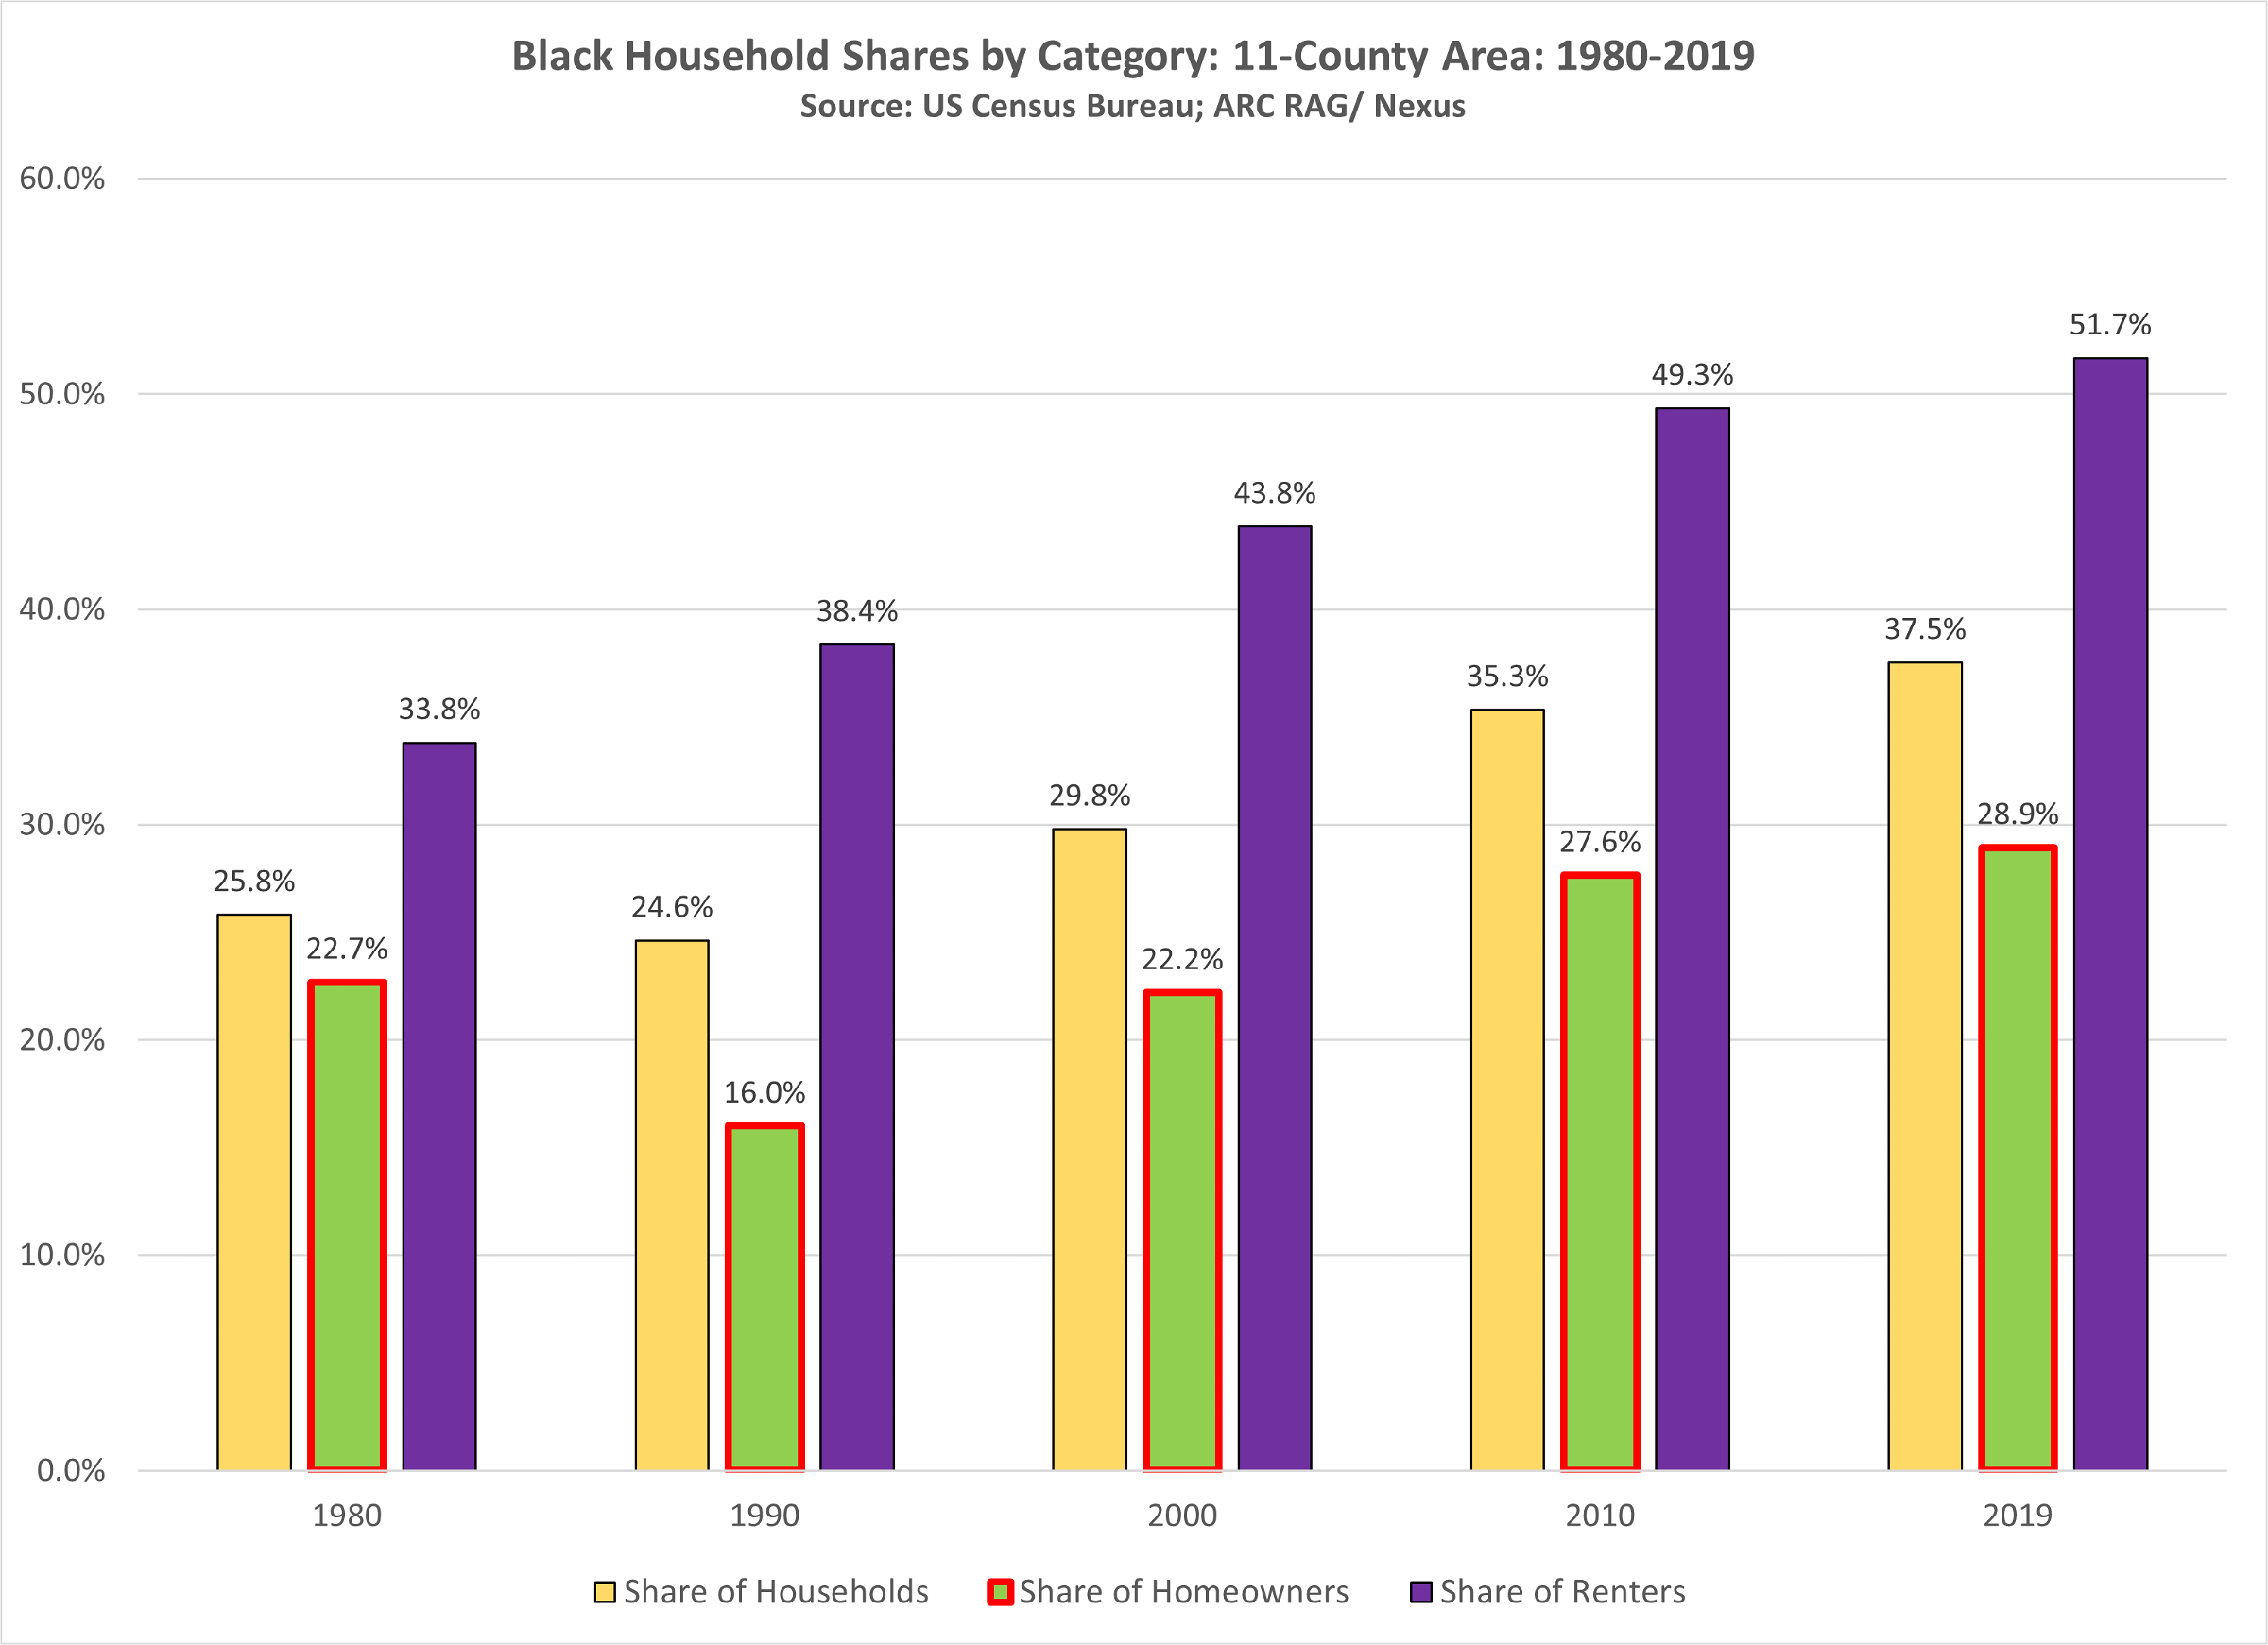
Black Homeownership: A Look at the 11-County Area, 1980-2019
Our Black population is significantly less likely to own a home than the population as a whole. While this gap has stayed present since 1980, it has narrowed, particularly in the 1990-2010 period.

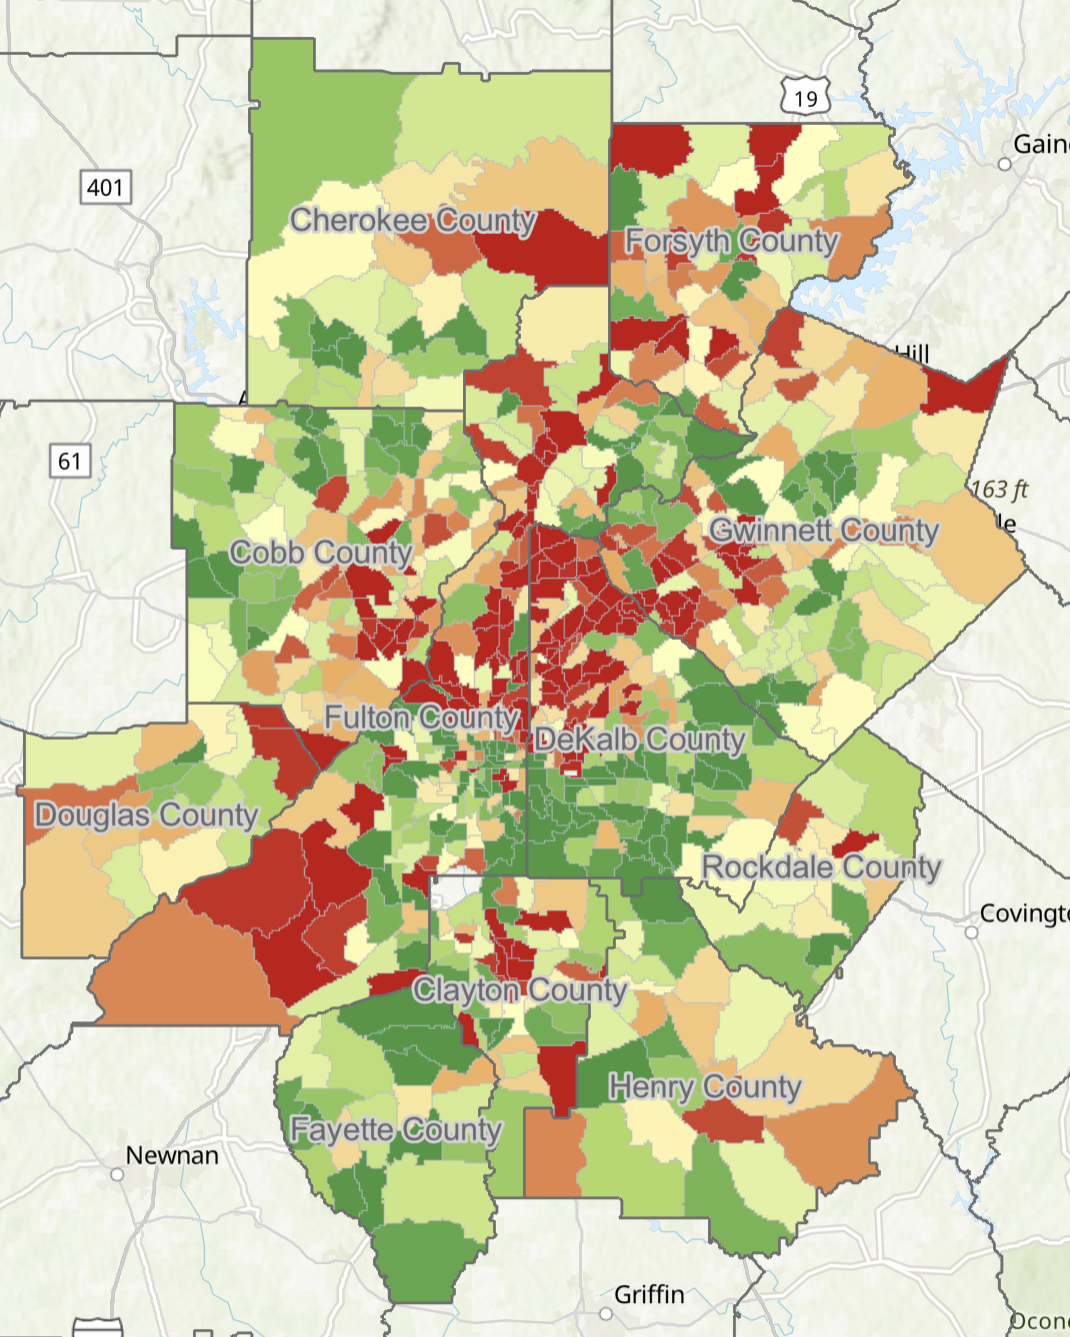
Georgia’s Non-Hispanic Black Population, from 2010 to 2020
We're kicking off Black History Month with an updated look at the state's Black population at the Census tract level, as well as examining change since 2010.
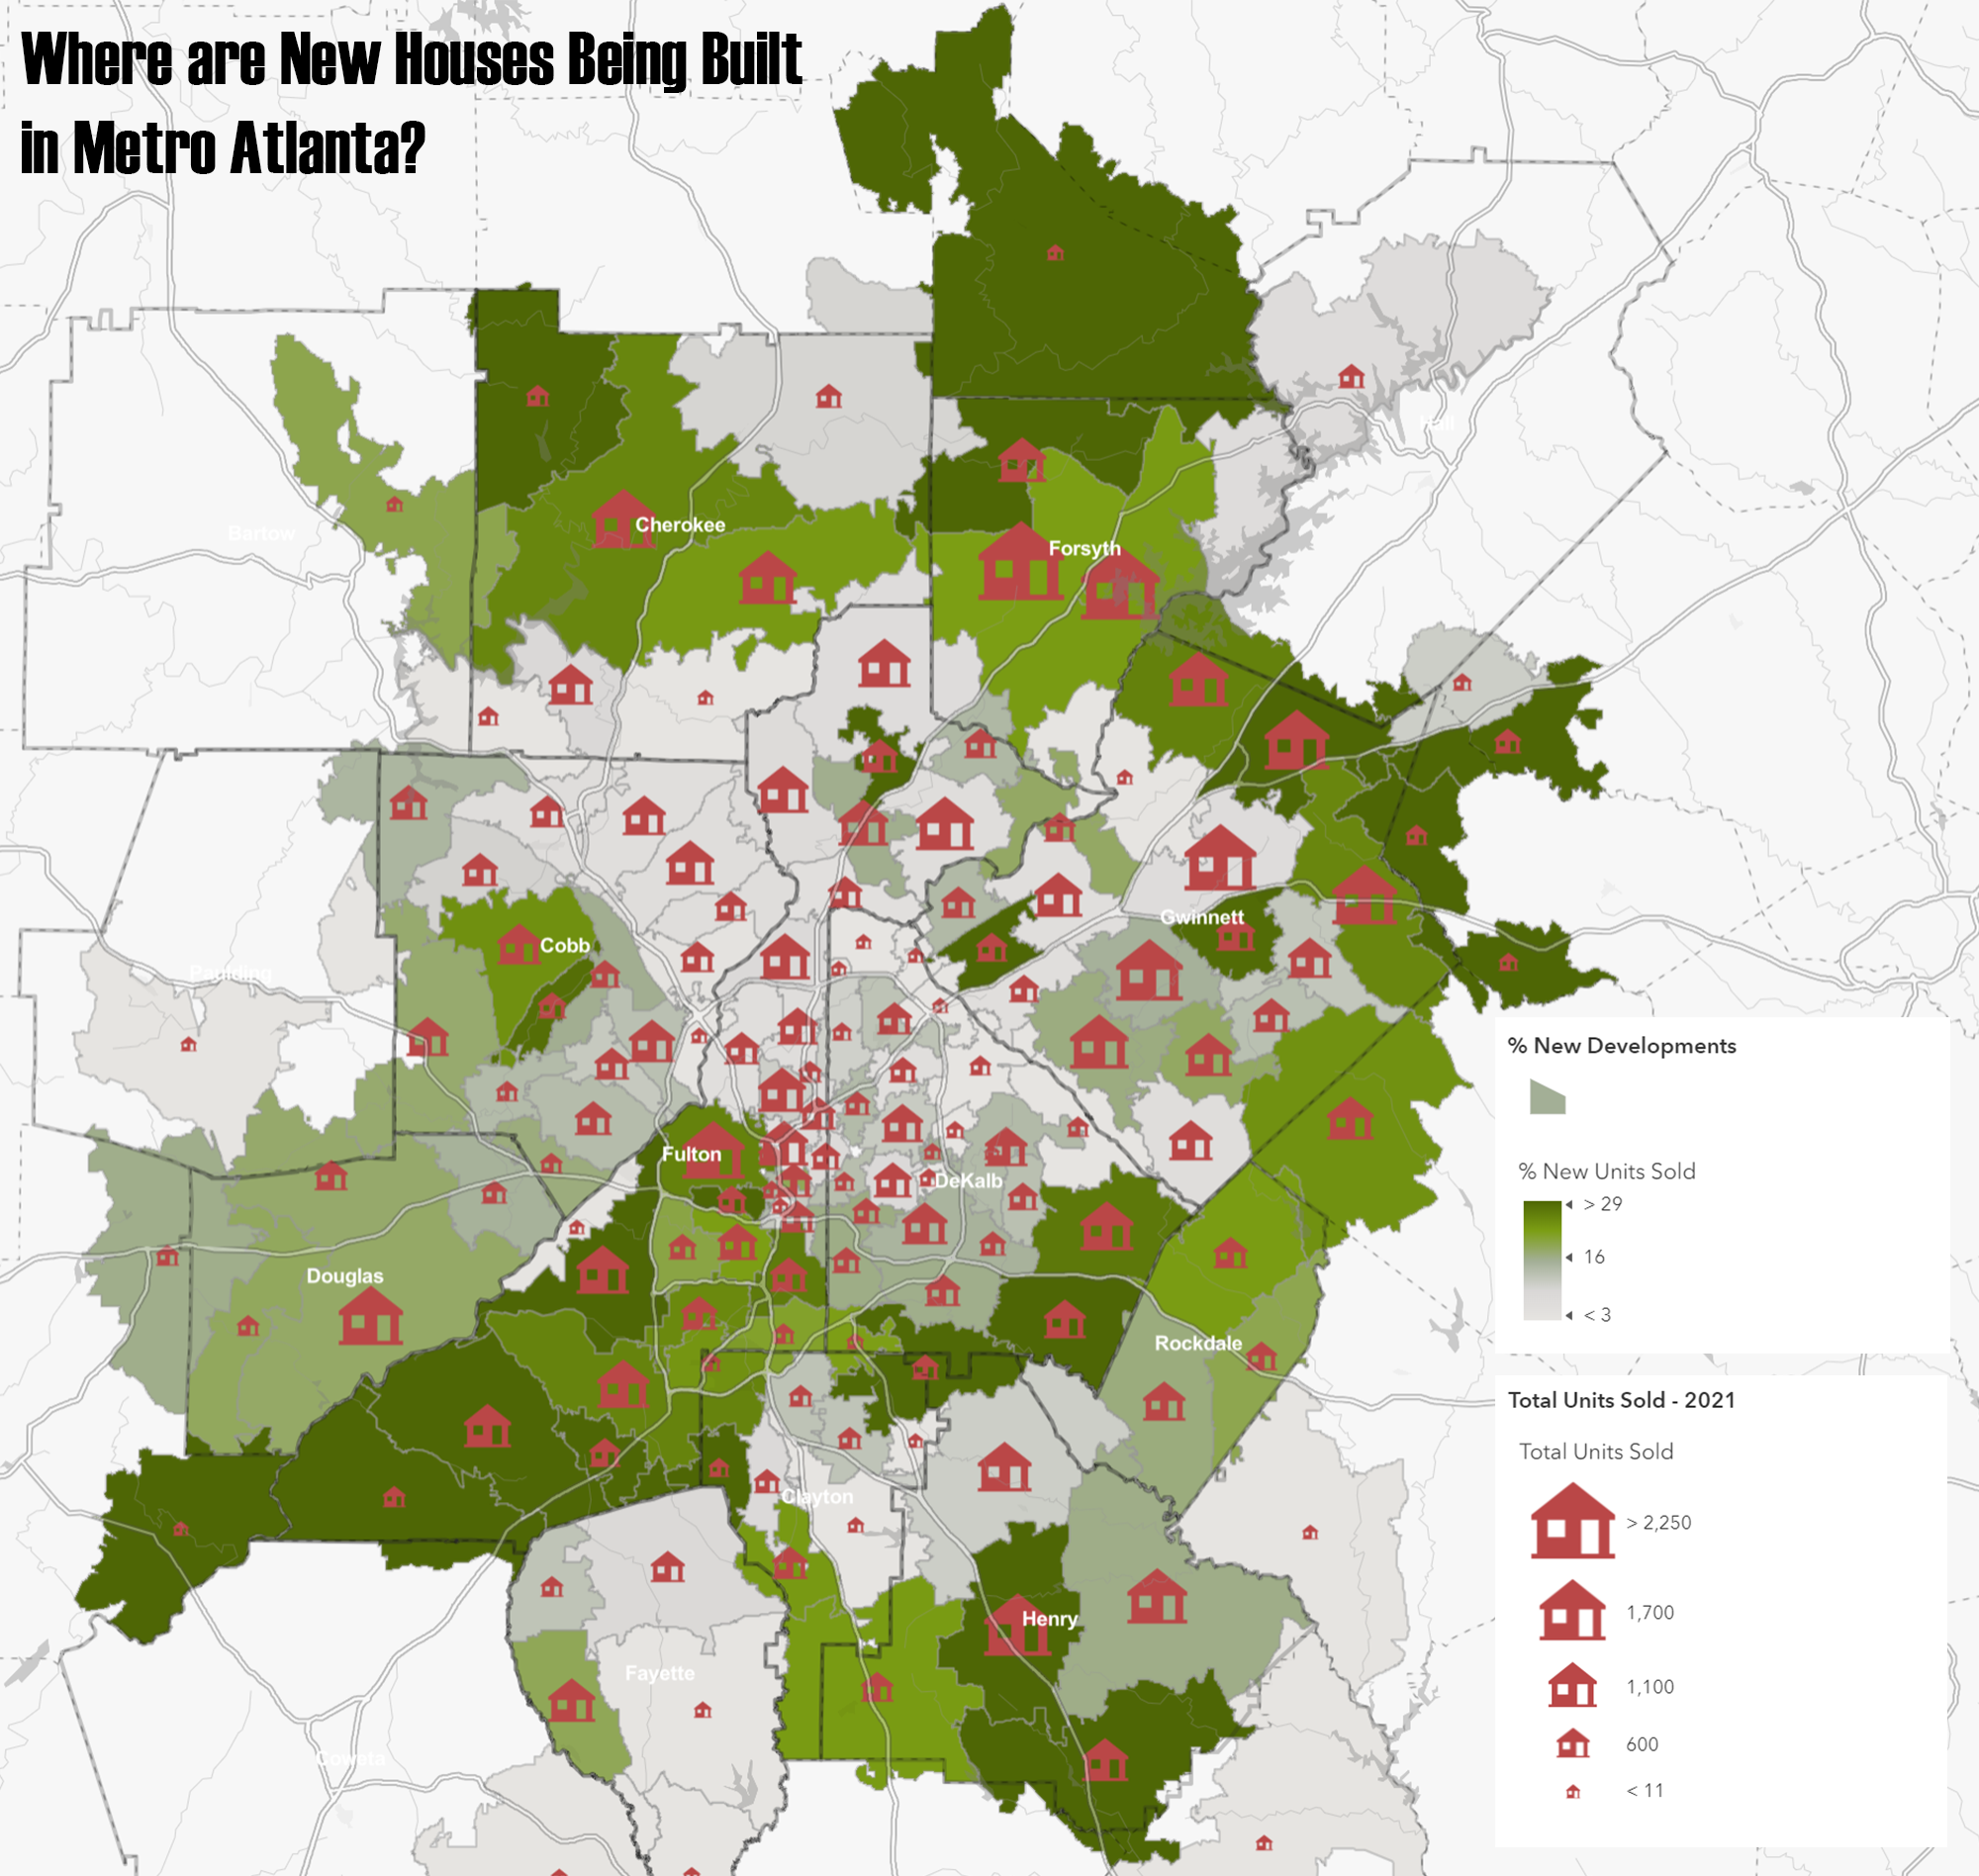
Just How Hot is Atlanta’s Housing Market?
The housing crisis is hardly unique to our area, but that doesn't make it any easier to address. We analyze new data from MarketNsight to pull out some interesting details about the price distribution and spatial patterns of new development in our region.
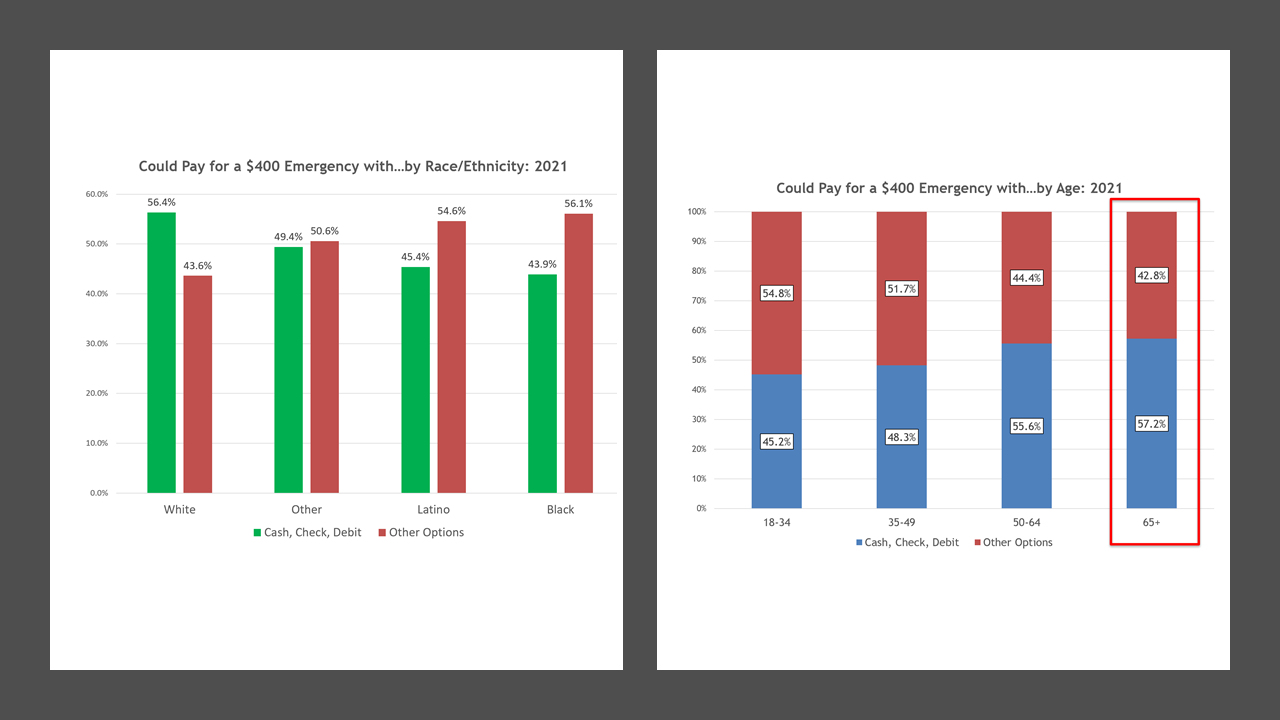
Metro Atlanta Speaks 2021: Assessing Stressors on Finance
The pandemic has brought emotional stress to all, driven in great measure by health and financial concerns. This post looks at Metro Atlanta Speaks data on our residents' ability (or lack thereof) to readily access funds for an emergency, comfortably make housing payments, and avoid food insecurity.
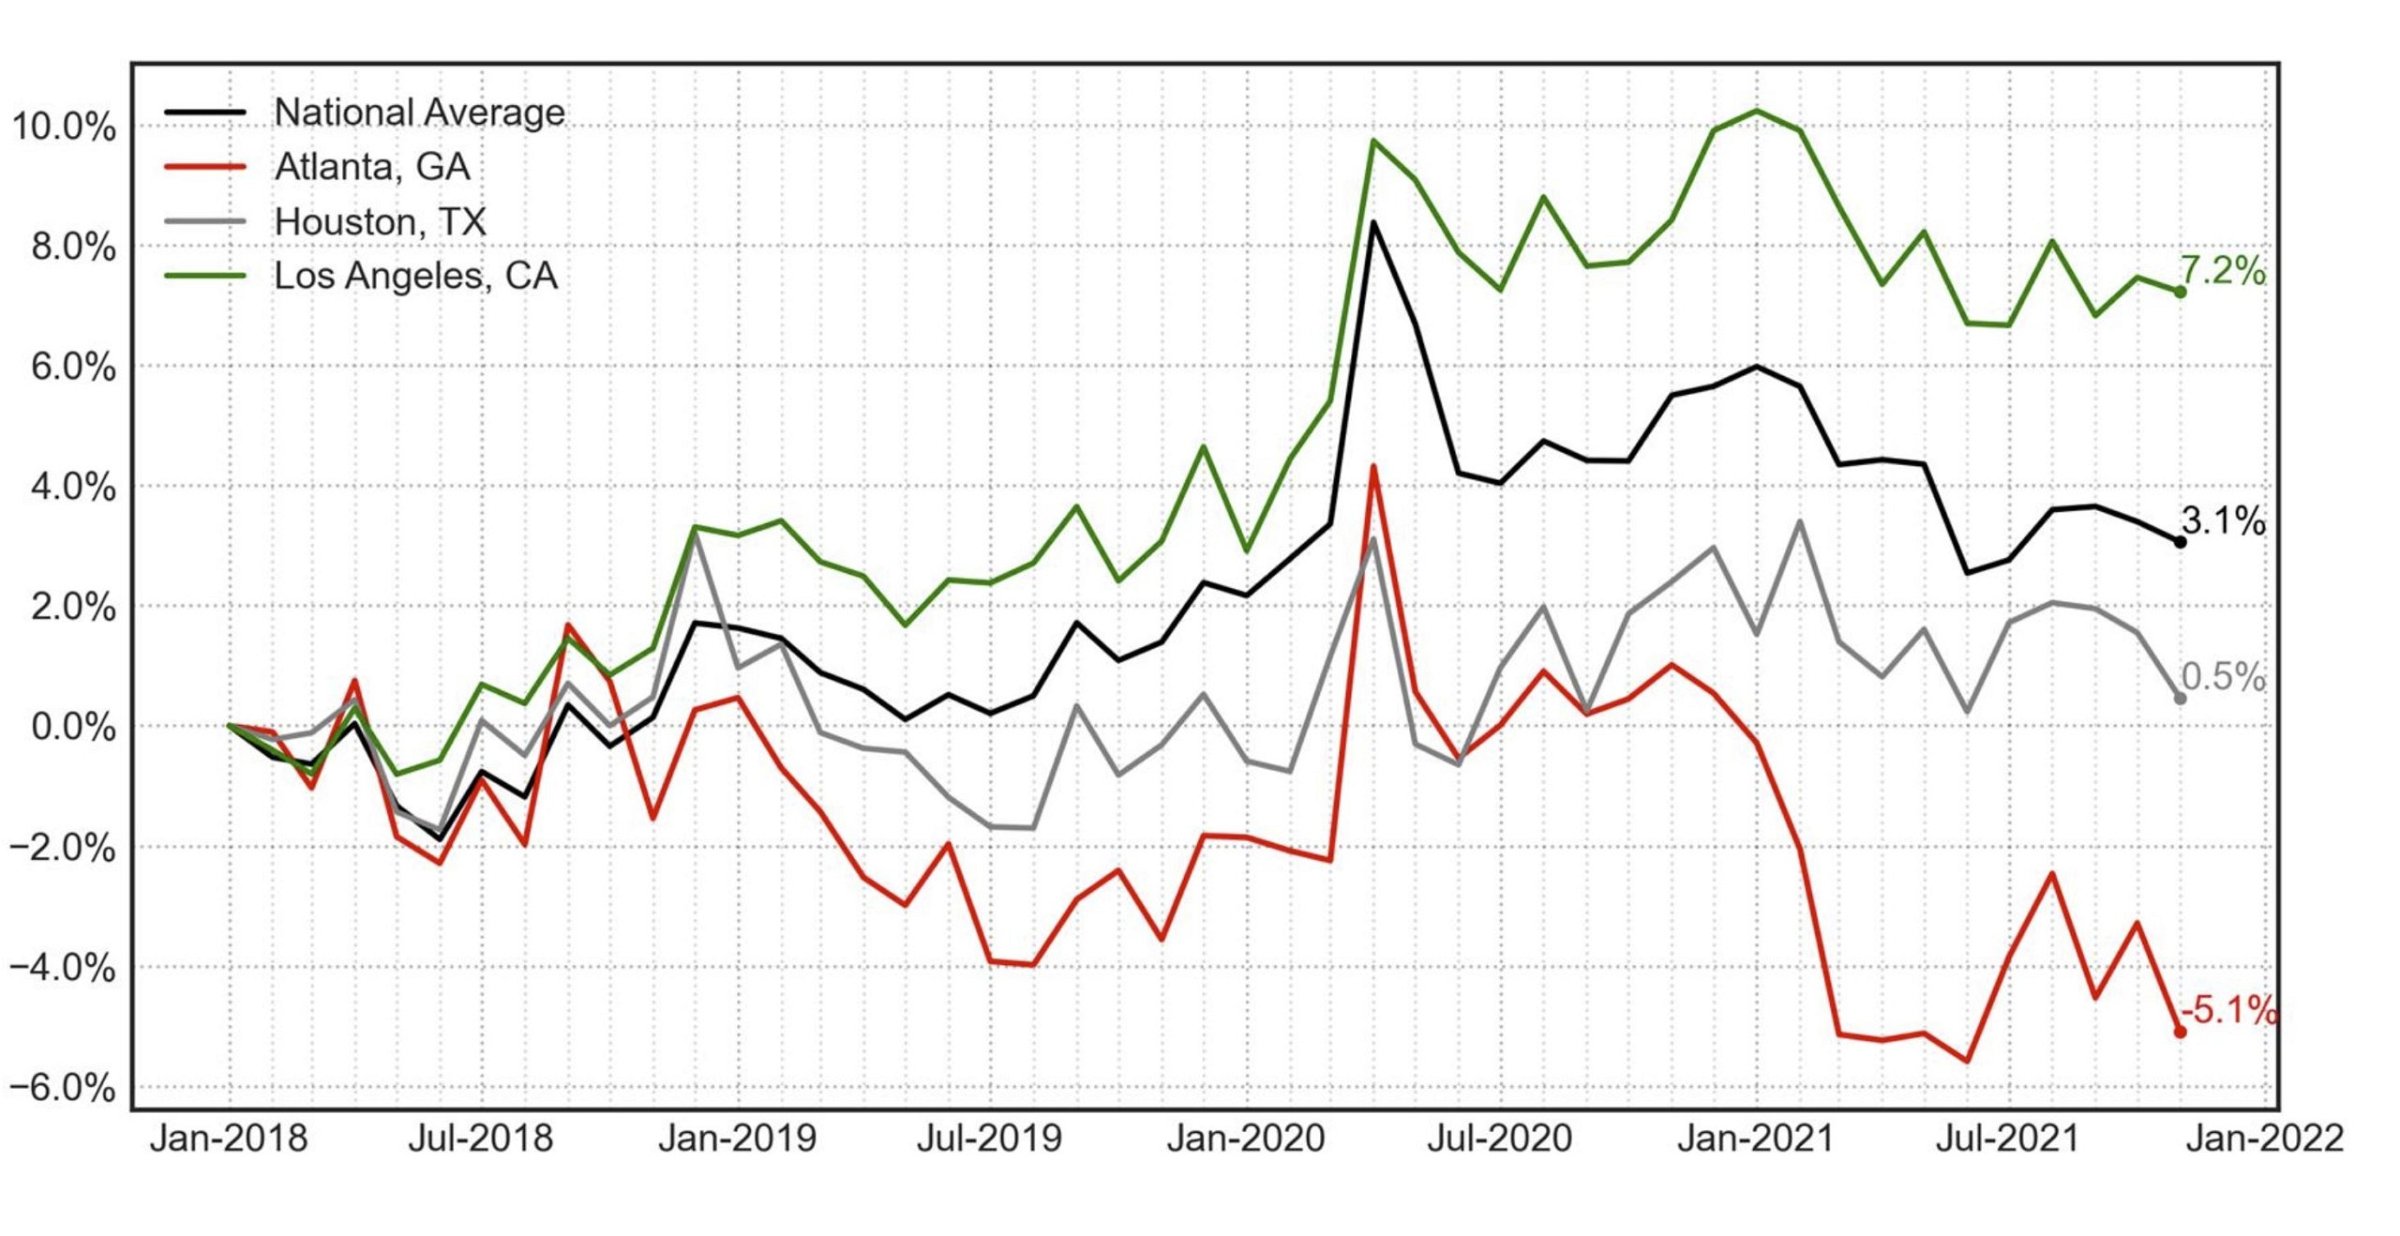
Got a Raise? You Still Might be Making Less (Than You Were)
Wages are going up. But so is inflation. What does it mean for real trends in Atlanta wages and how do the findings differ by metro area?
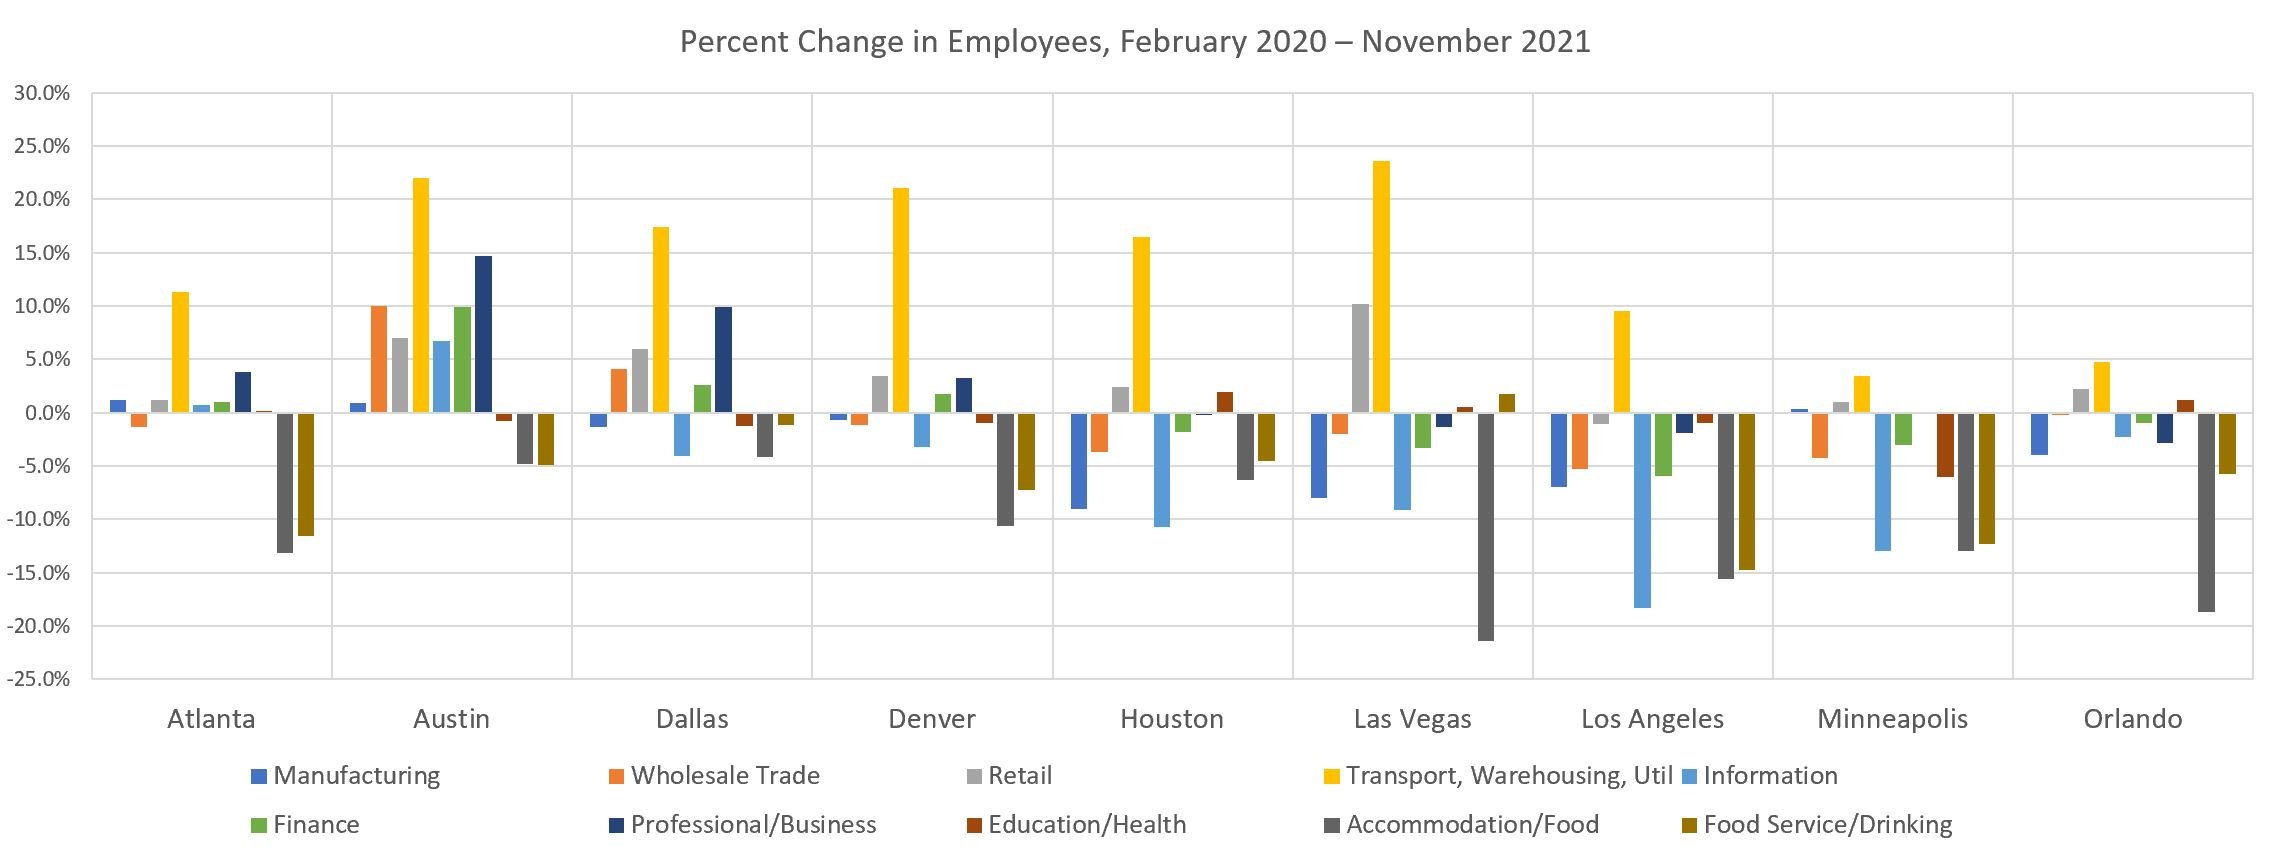
Regional Snapshot: The Economy-An Overview for the New Year
There is a LOT going on in our economy. Wages and inflation are up, and so are housing prices and rents. While we have a lot of job openings, we also have a low unemployment rate. Our January Regional Snapshot takes a look at a confusing and changing economic landscape, at almost two full years into the pandemic.
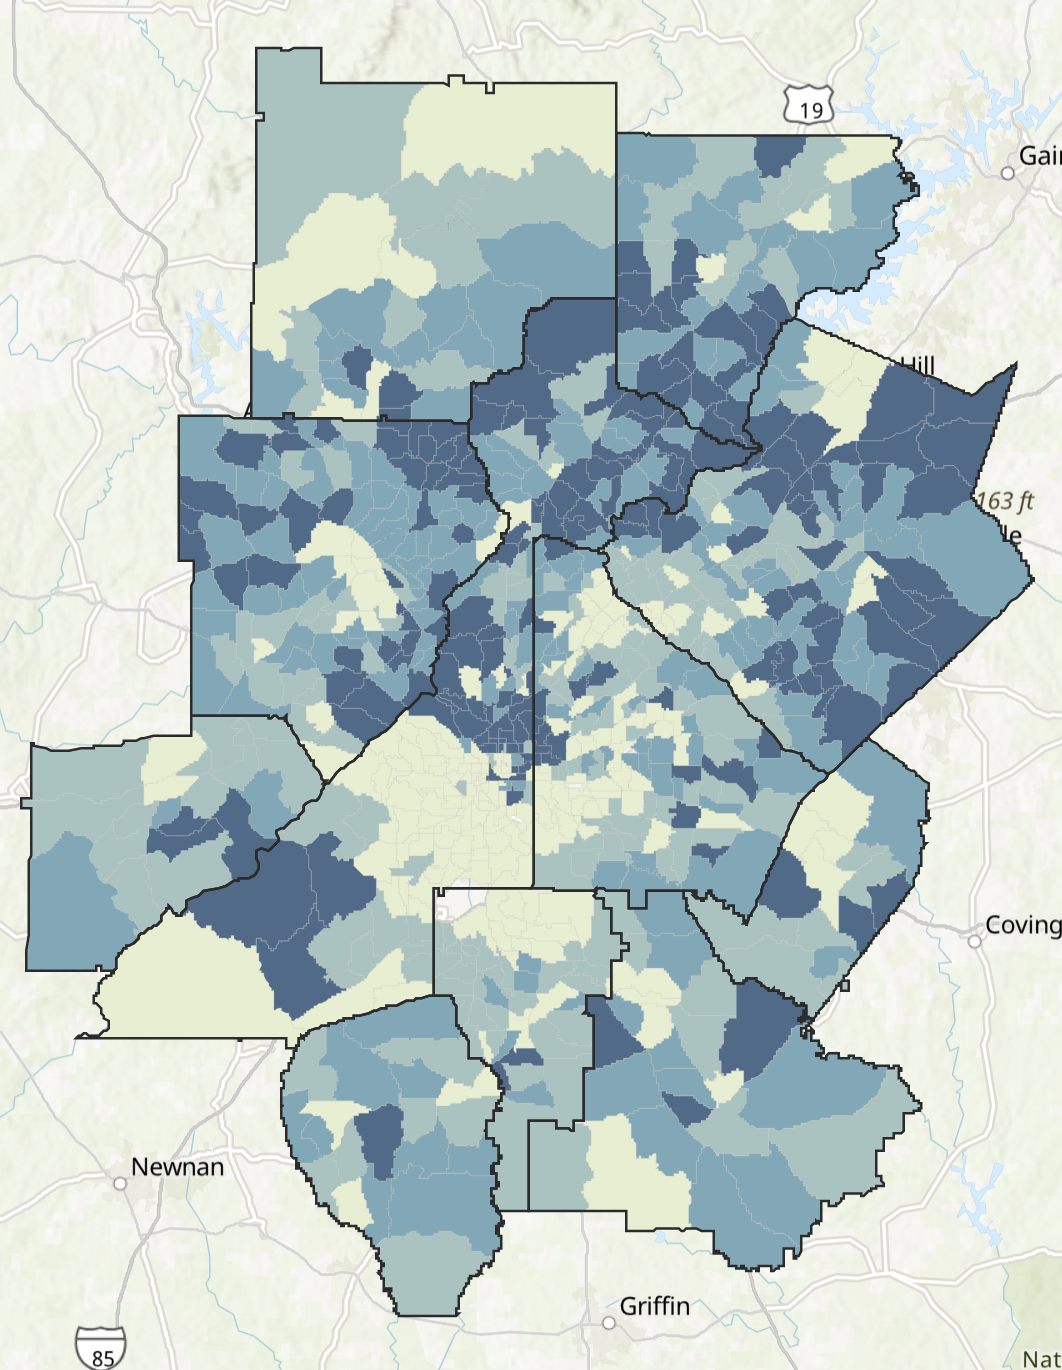
Computer and Internet Access Across the 11-County Area
With schools considering a return to remote learning to prevent omicron surges among students and faculties, it's again worth a look at which communities are best positioned to handle quick switches and where we see the largest shares of school-age children.
Estimating Santa’s Stress, 2021
A very scientific approach to estimating Old Saint Nick's stress levels as he traverses the 11 county area.