Black History Month draws to a close next week. This month’s responsive series of blog posts exploring racial disparities concludes with a focus on two more questions in the Metro Atlanta Speaks (MAS) survey Responses to these provide unique data on our residents’ opinions (and knowledge) about income inequality and the Black: White racial income gap. To sum up the findings before we “dive deeper”, the answers show that (a) residents agree that we as a region have a problem with economic equality, but also that (b) they don’t begin to grasp the breadth of a racial wealth gap that exemplifies that problem. As such, a reasonable concern exists that our region might struggle to grapple with the extent of possible policy interventions that might be needed to address the problem(s).
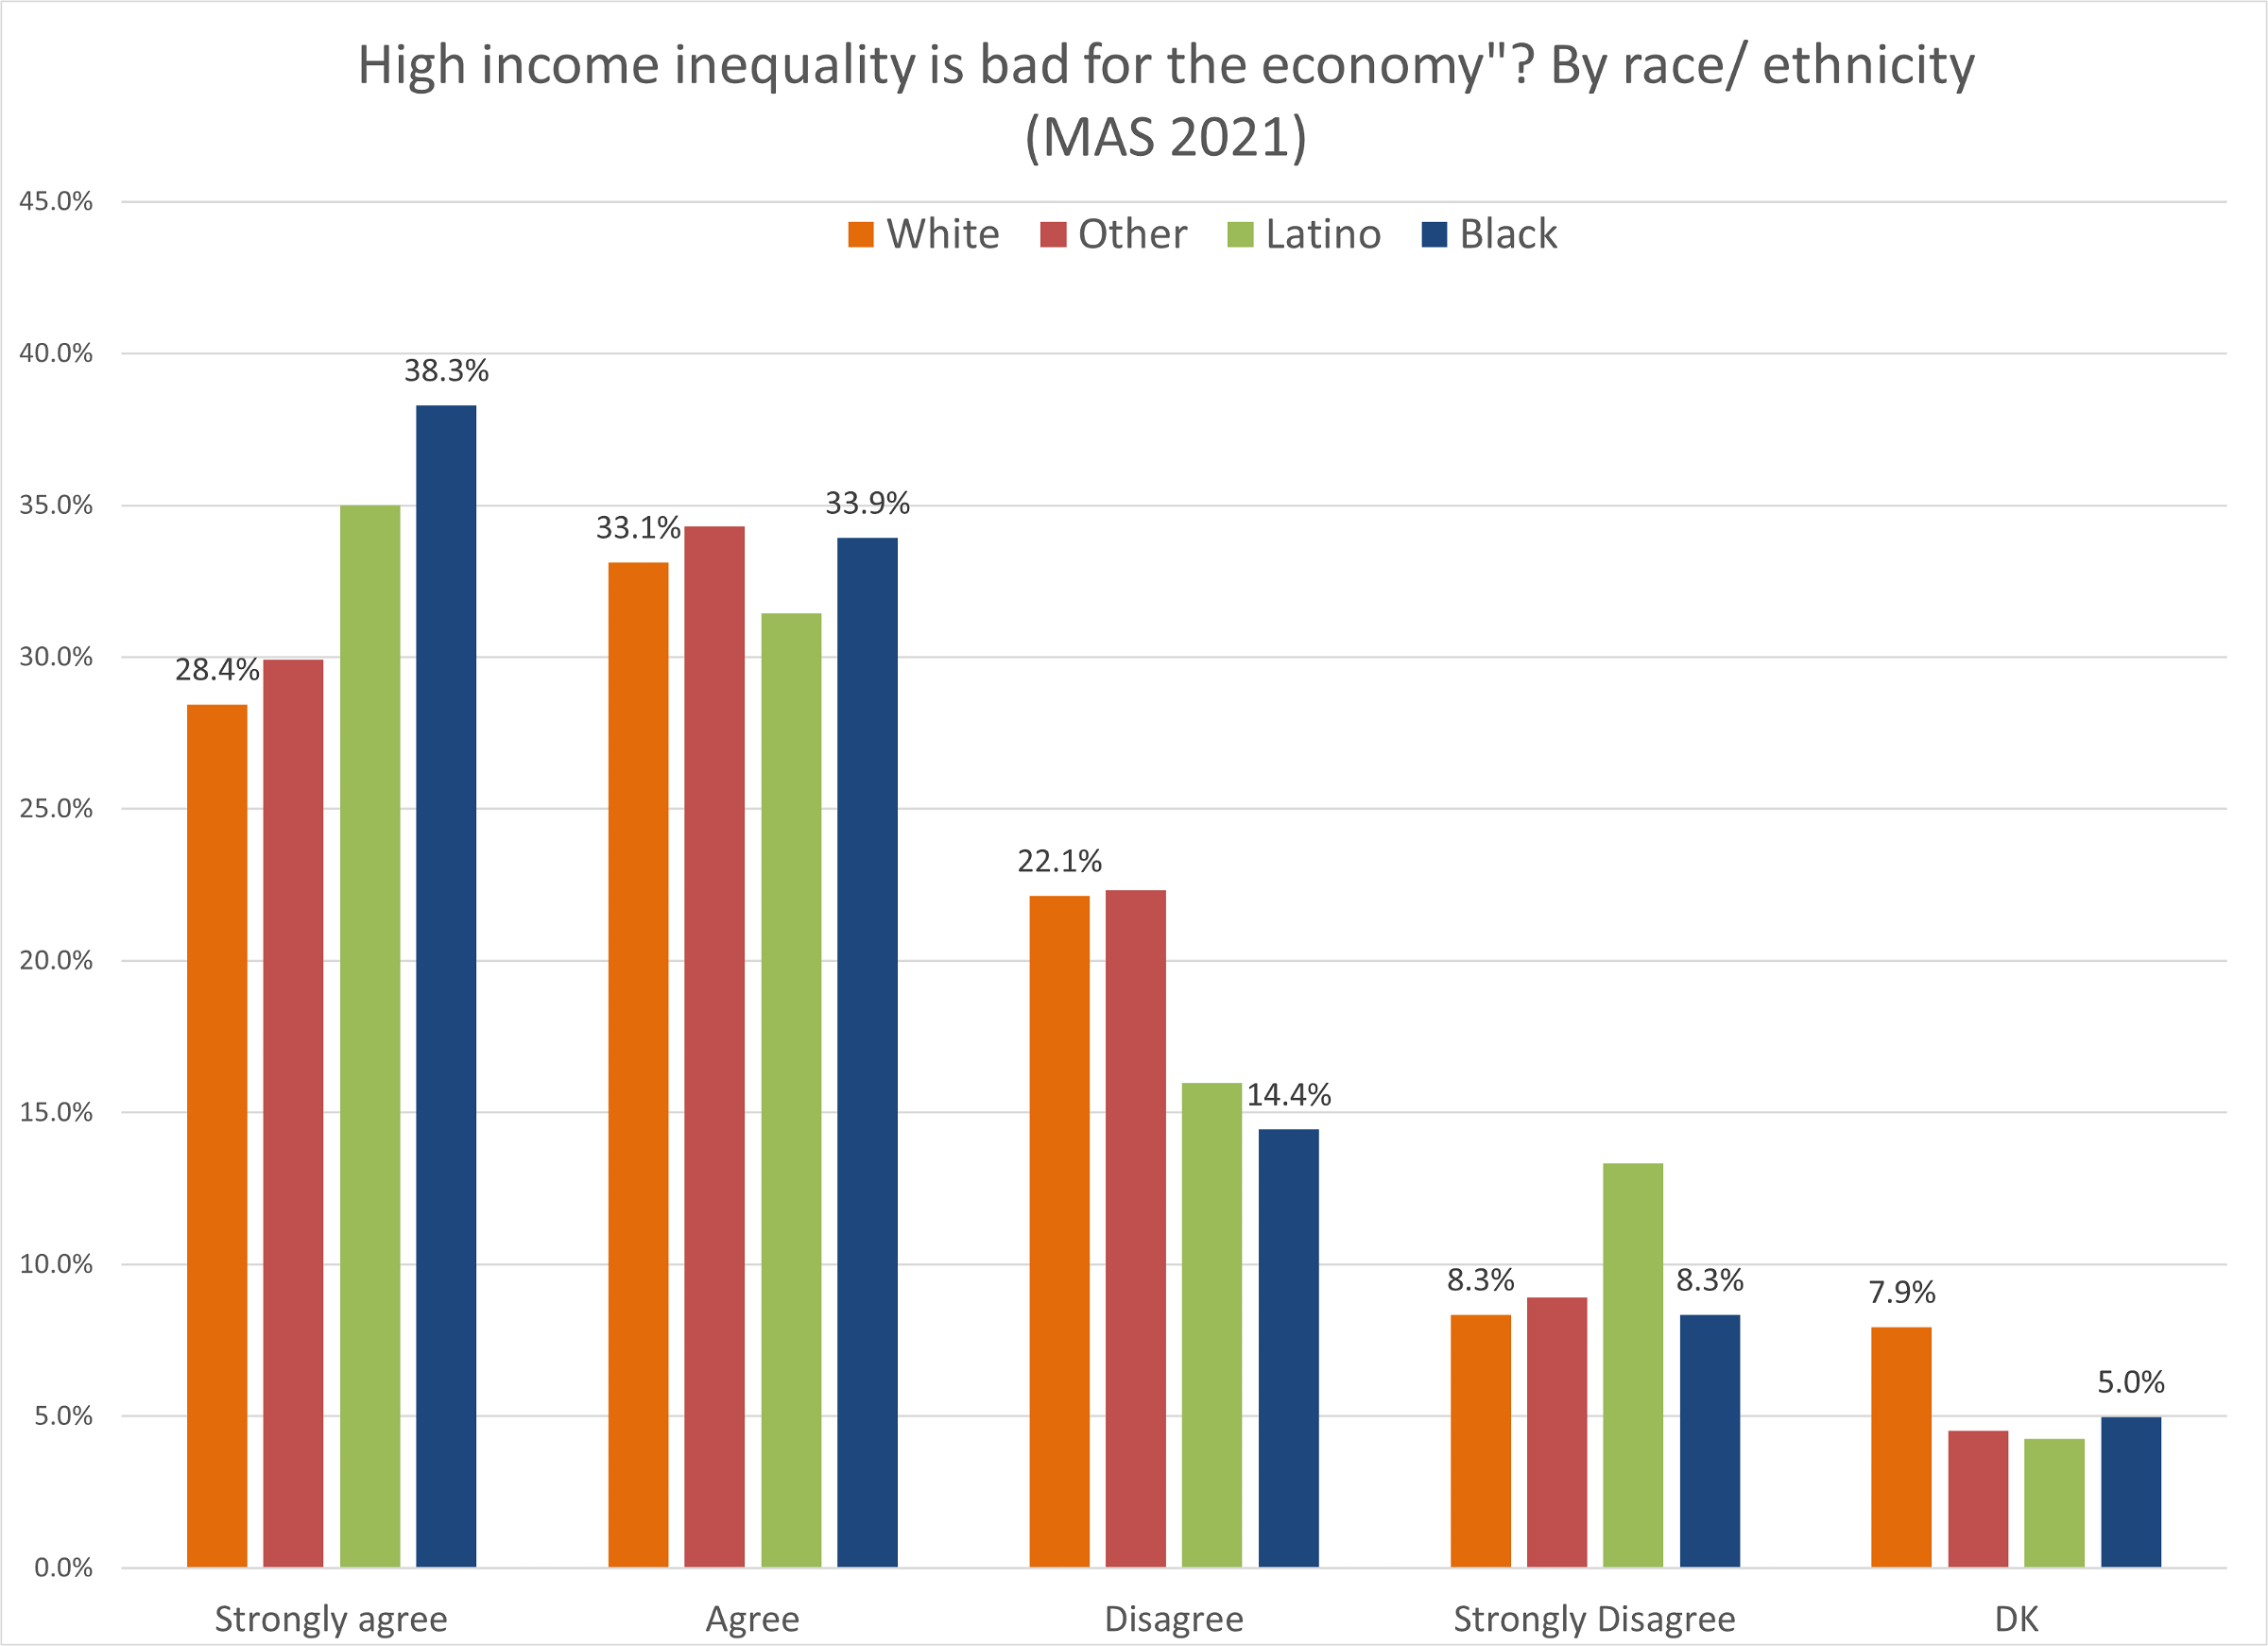
For the first time this year, MAS included a question measuring attitudes on damage created by income inequality. There appears high agreement about the negative effects of such–though there is more awareness in non-White demographic groups. Chart 1 reveals that over 3 in 4 of survey respondents think unequal incomes are detrimental. Higher shares are found in more urban counties, with lower shares (still healthy majorities) in suburban jurisdictions. Chart 2 data indicates that 7 in 10 Black respondents agree or strongly agree (nearly 4 in 10 strongly agree) that income inequality is damaging; a slightly, but still significantly owner share of 6 in 10 whites agree.
Chart 1: Do High Levels of Income Inequality Negatively Impact the Economy? : MAS 2021
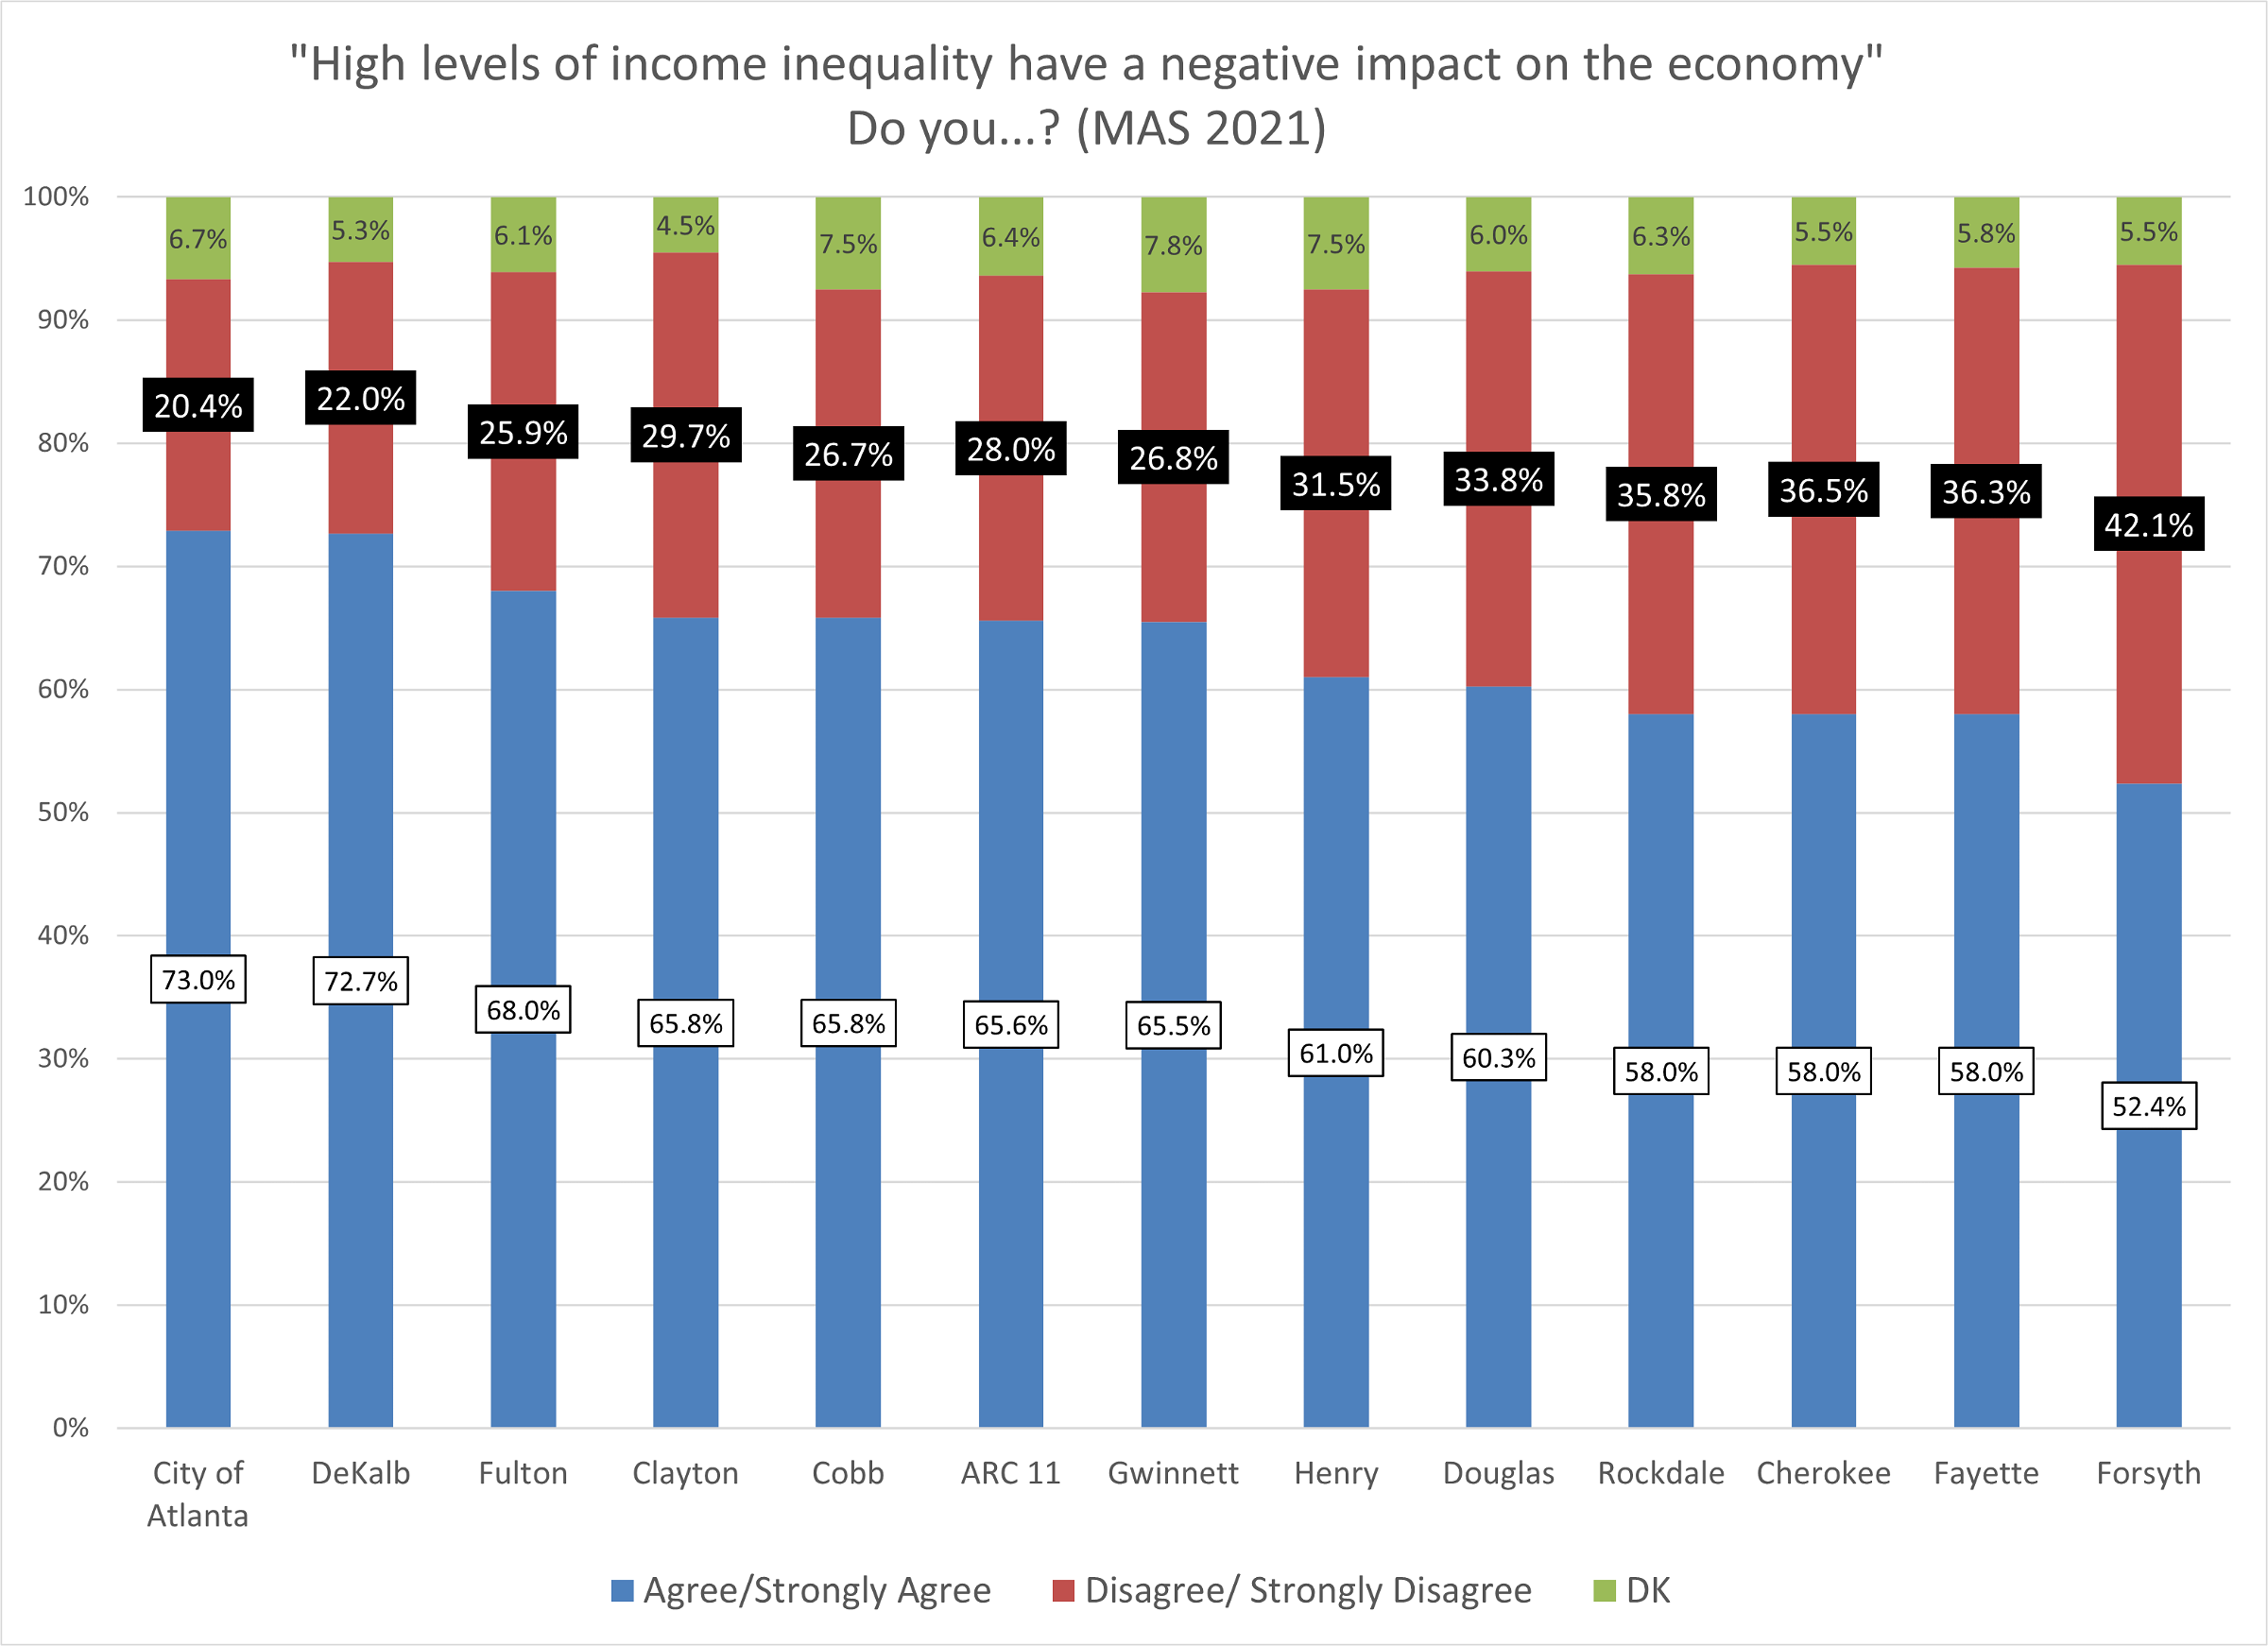
Chart 2: By Race/ Ethnicity: Do High Levels of Income Inequality Negatively Impact the Economy? : MAS 2021
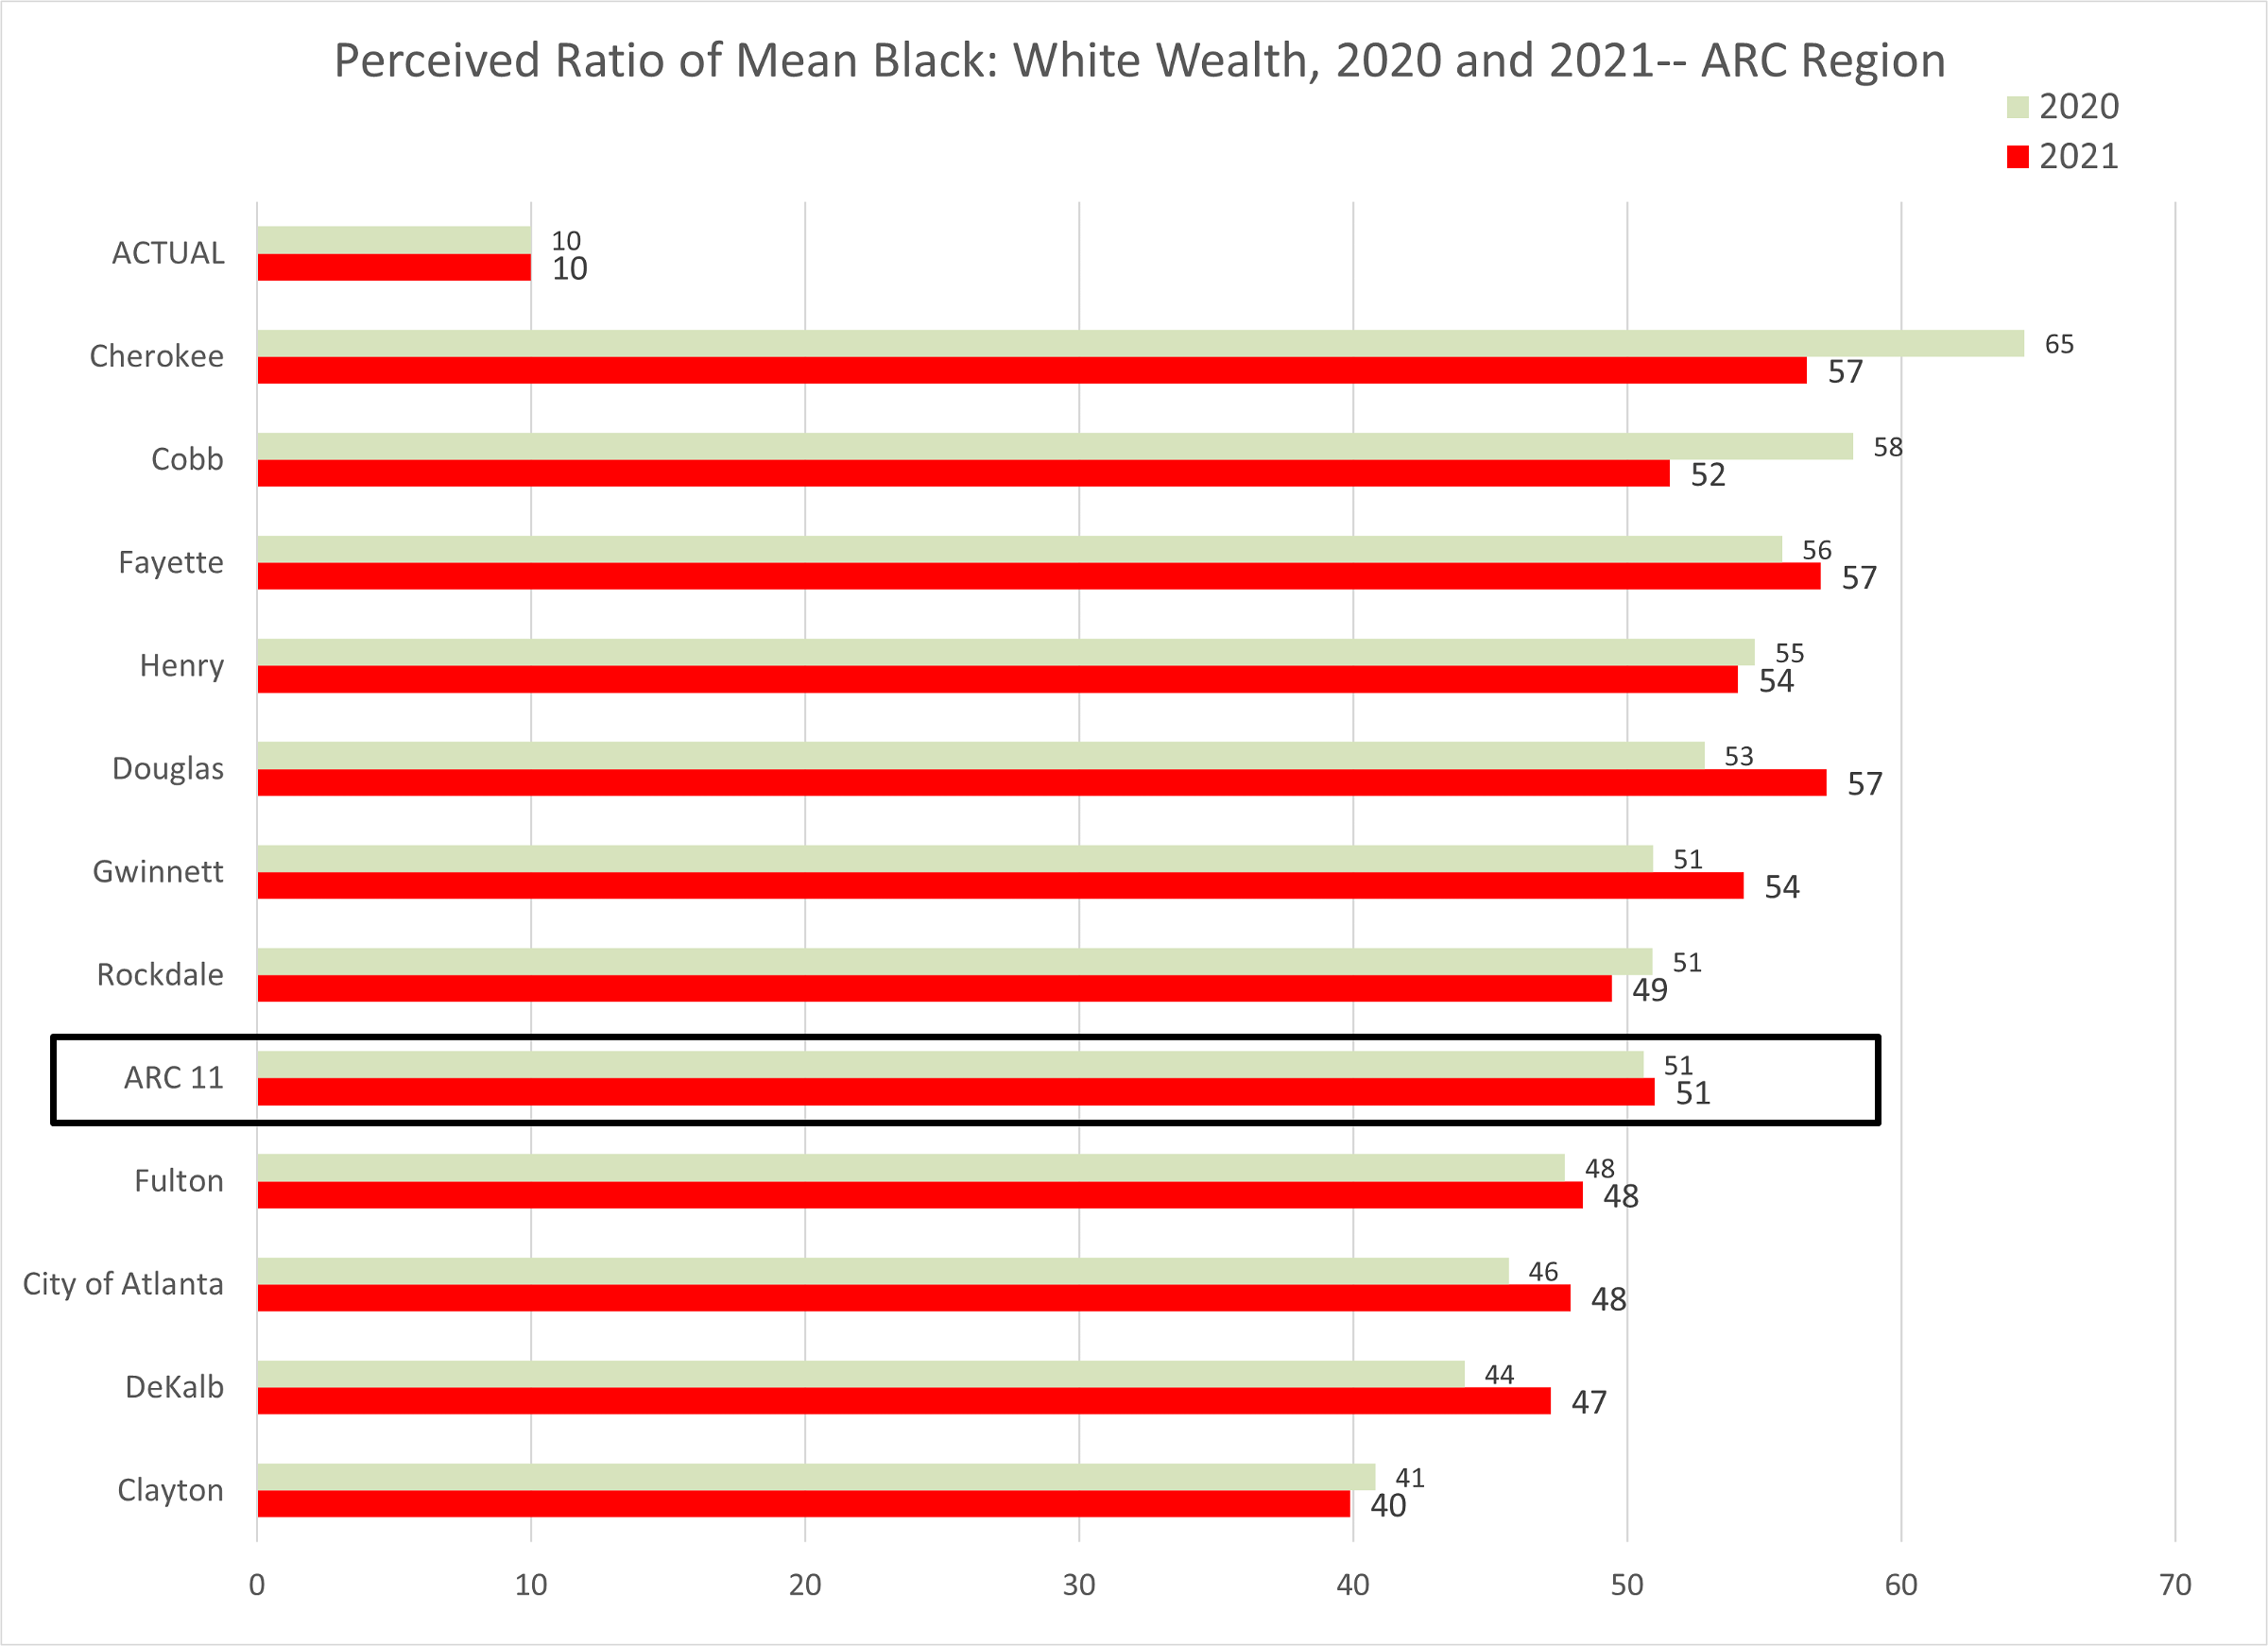
As alluded to earlier, one of the key obstacles to policy initiatives to lead to less income inequality is ignorance about the true extent of that income inequality, across races and between races & ethnicities. We asked in 2021 (for the second year) a related question about the relationship of Black wealth to White wealth–and we continued to find a lack of awareness about the extent of the wealth gap. The data of Chart 3 illustrate the extent/ degree of this ‘knowledge gap’ about the Black: White wealth ratio. In every jurisdiction, respondents thought that the average Black: White ratio was 1:4 or closer. It is actually 1:10. as shown in Chart 4, knowledge of the wealth gap got “better”–or closer to 1:10, in only a few areas, from 2020 to 2021. Most of what “improvement occurred was found in areas that (in 2021) still showed the greatest wealth ‘knowledge gaps’.
Chart 3: MAS 2021: Perceived Ratio of Mean Black to White Wealth, By County
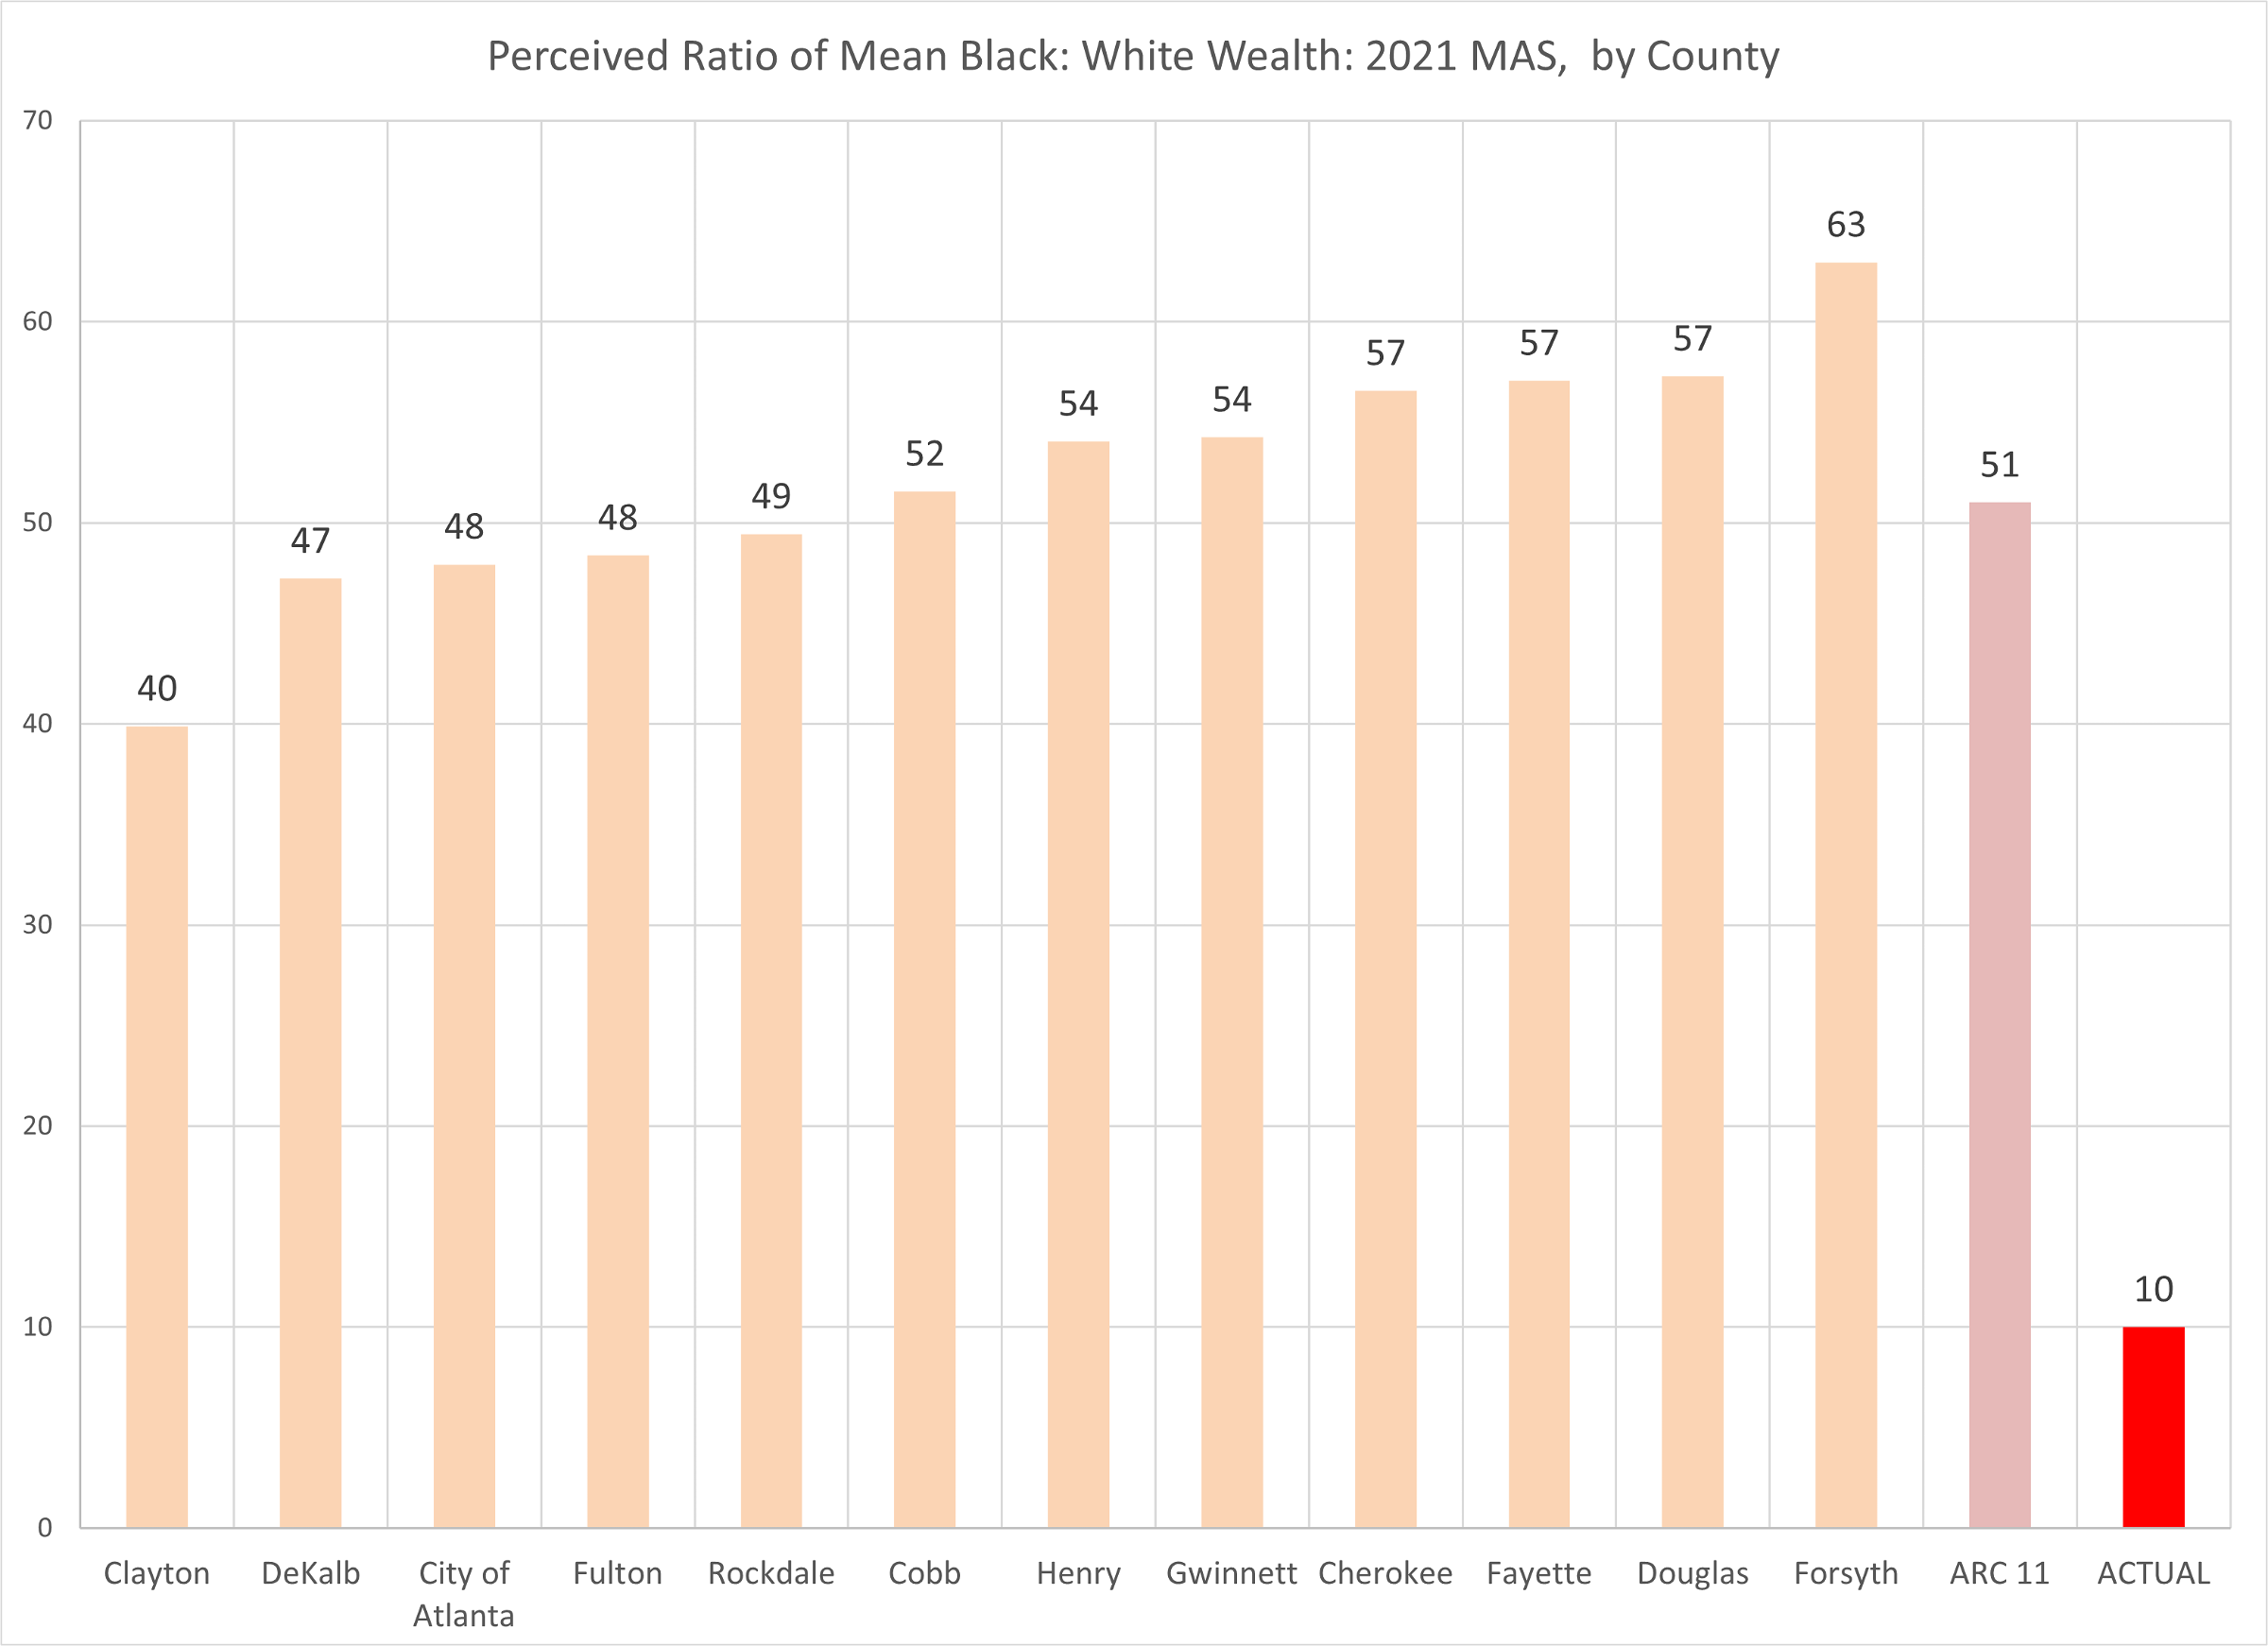
Chart 4: “Over Time”: Perceived Ratio of Mean Black Wealth to White Wealth: MAS 2020 and 2021
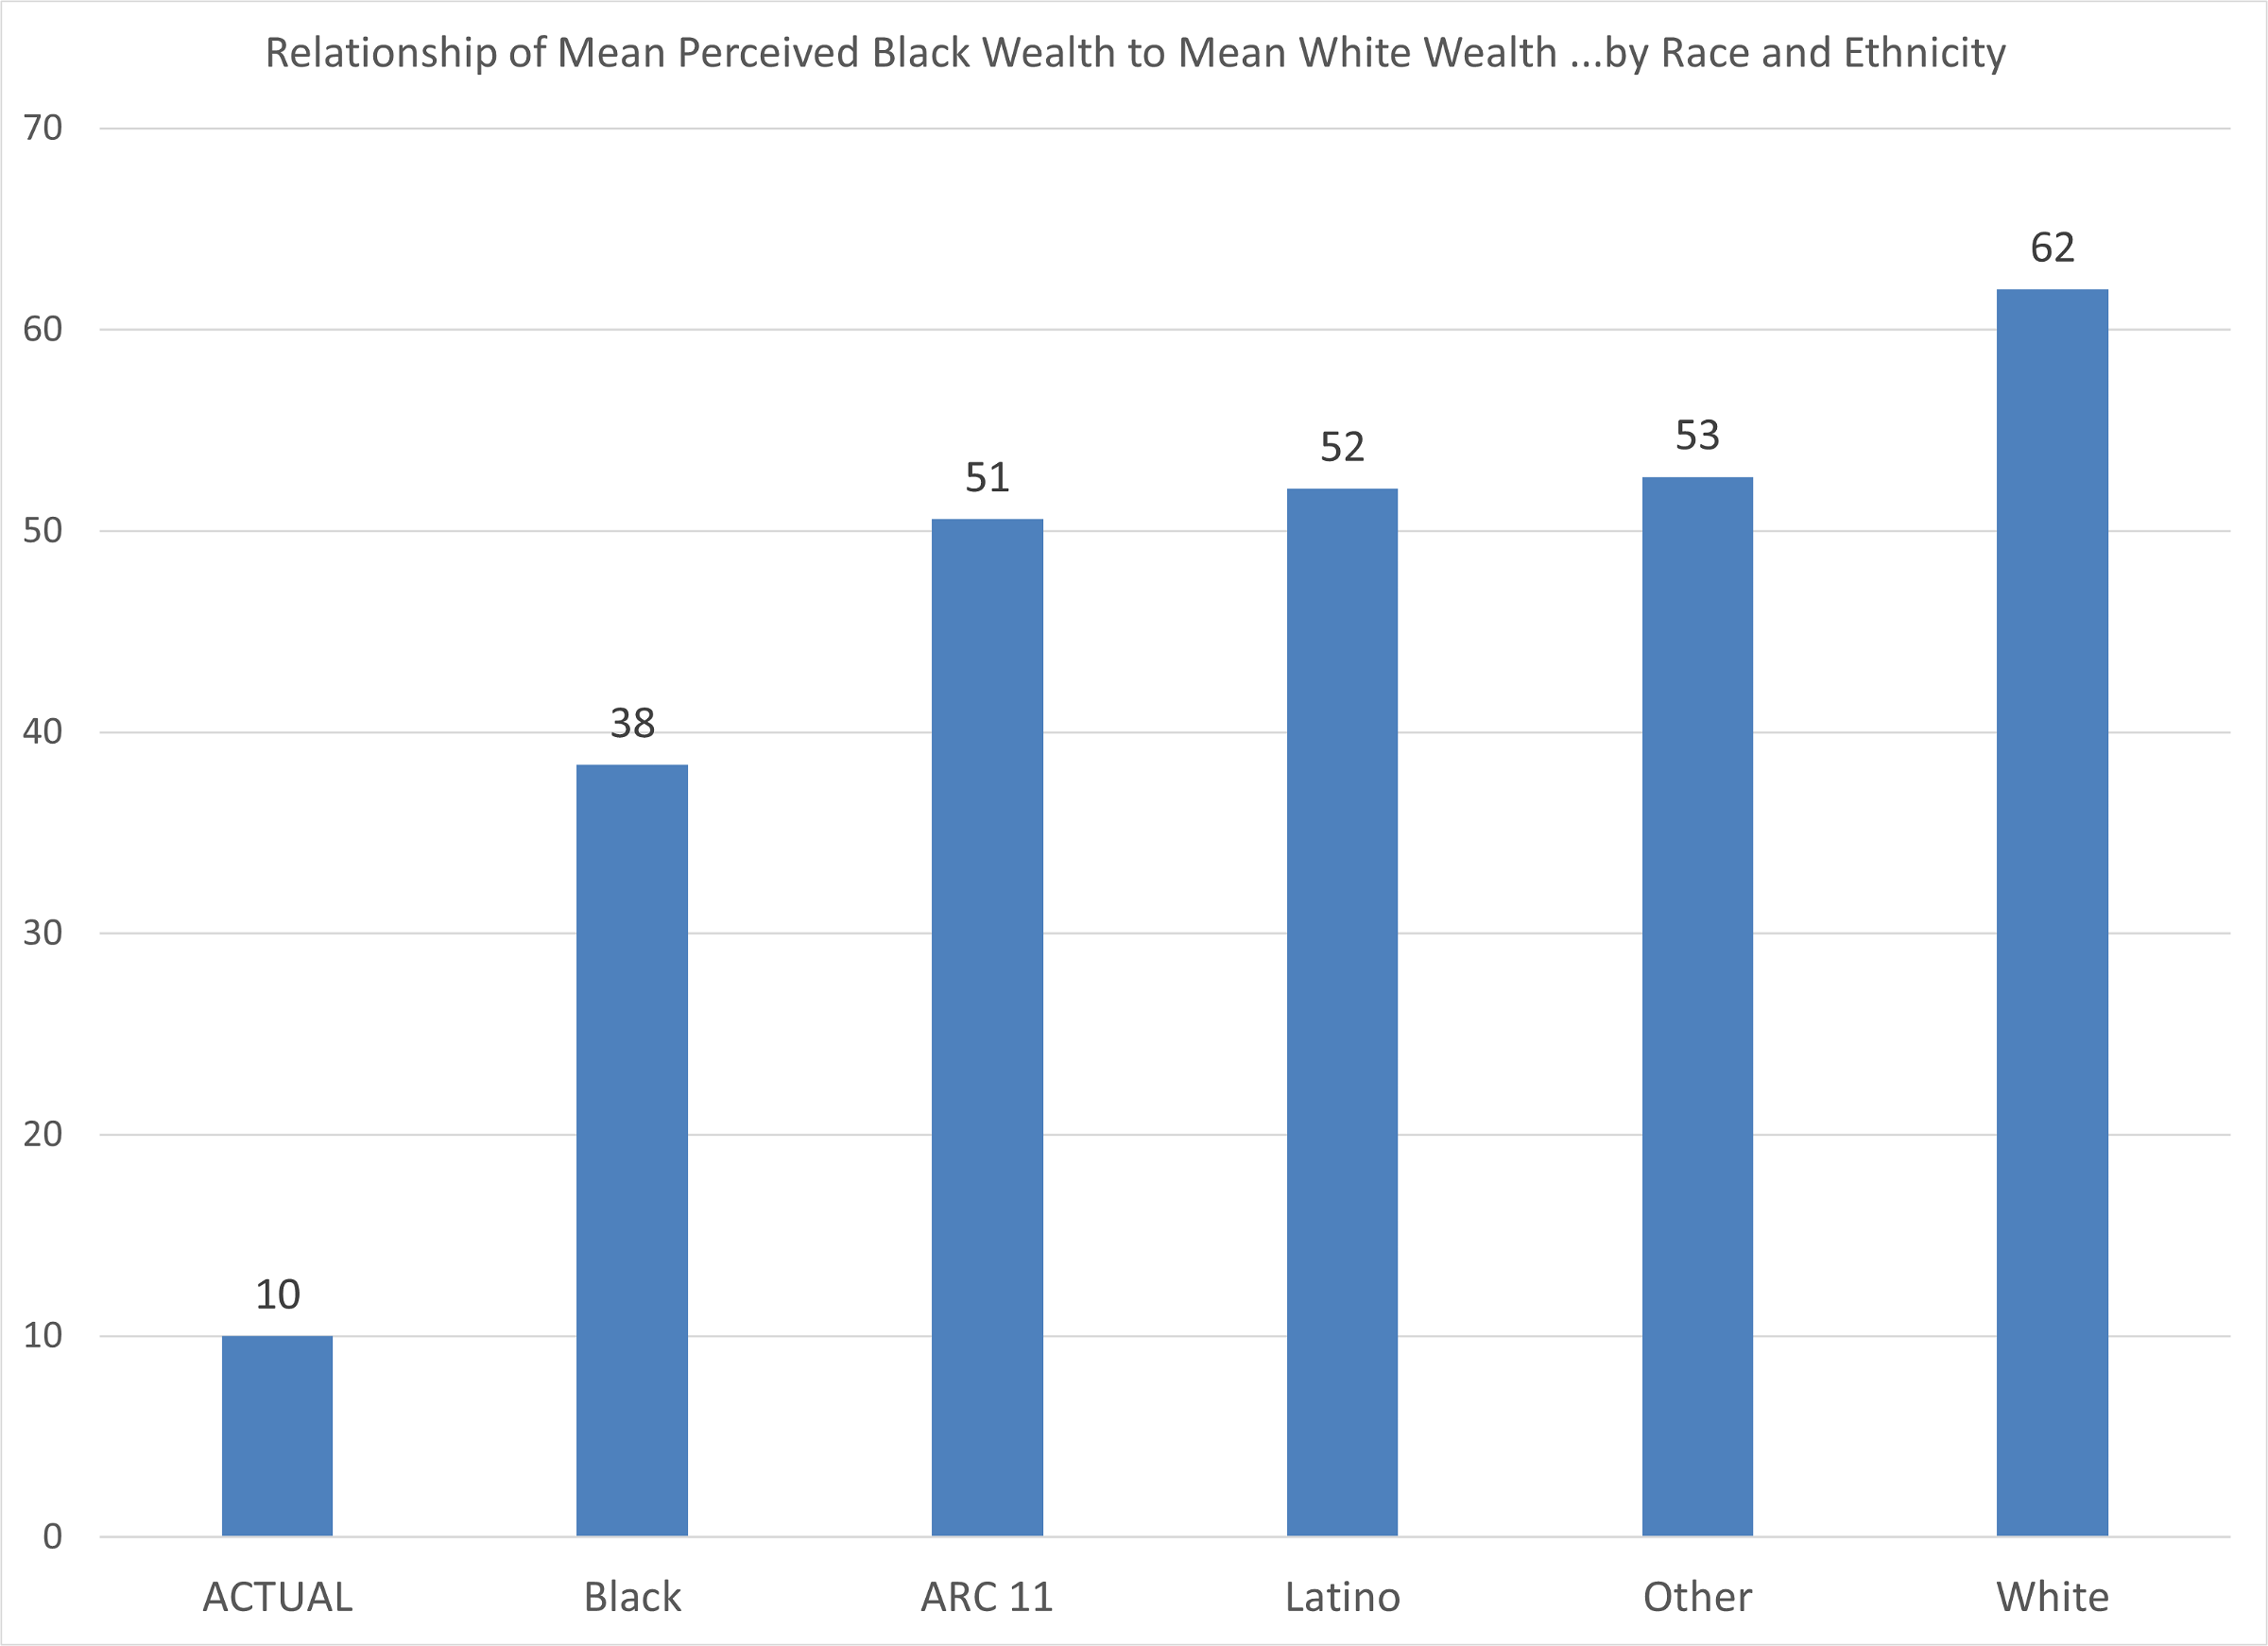
Charts 5 and 6 provide more detail on the responses to the “wealth question”. With Chart 5, we see just how “far off” respondents in all counties were from nearing the true 10% ratio of average Black wealth to average White wealth. 3 in 10 respondents, across the entire 11 counties, thought that average Black wealth was 50% or more of mean White wealth–as opposed to the true value of 10% of mean White wealth. Only in Clayton County, with a relatively high share of Black population as well as relatively lower incomes, does this share drop to 1 in 5. Then finally, Chart 6 makes it pretty clear that a dramatic wealth knowledge deficit is not confined to particular races or ethnicities. While White and Latino groups are most likely to believe that Black wealth is closest to White wealth, even Black respondents believed on average that the wealth ratio was 38% (when it is in fact, again, 10%).
Chart 5: Share of Respondents Believing Avg. Black Wealth 50% or More of Average White Wealth : MAS 2021
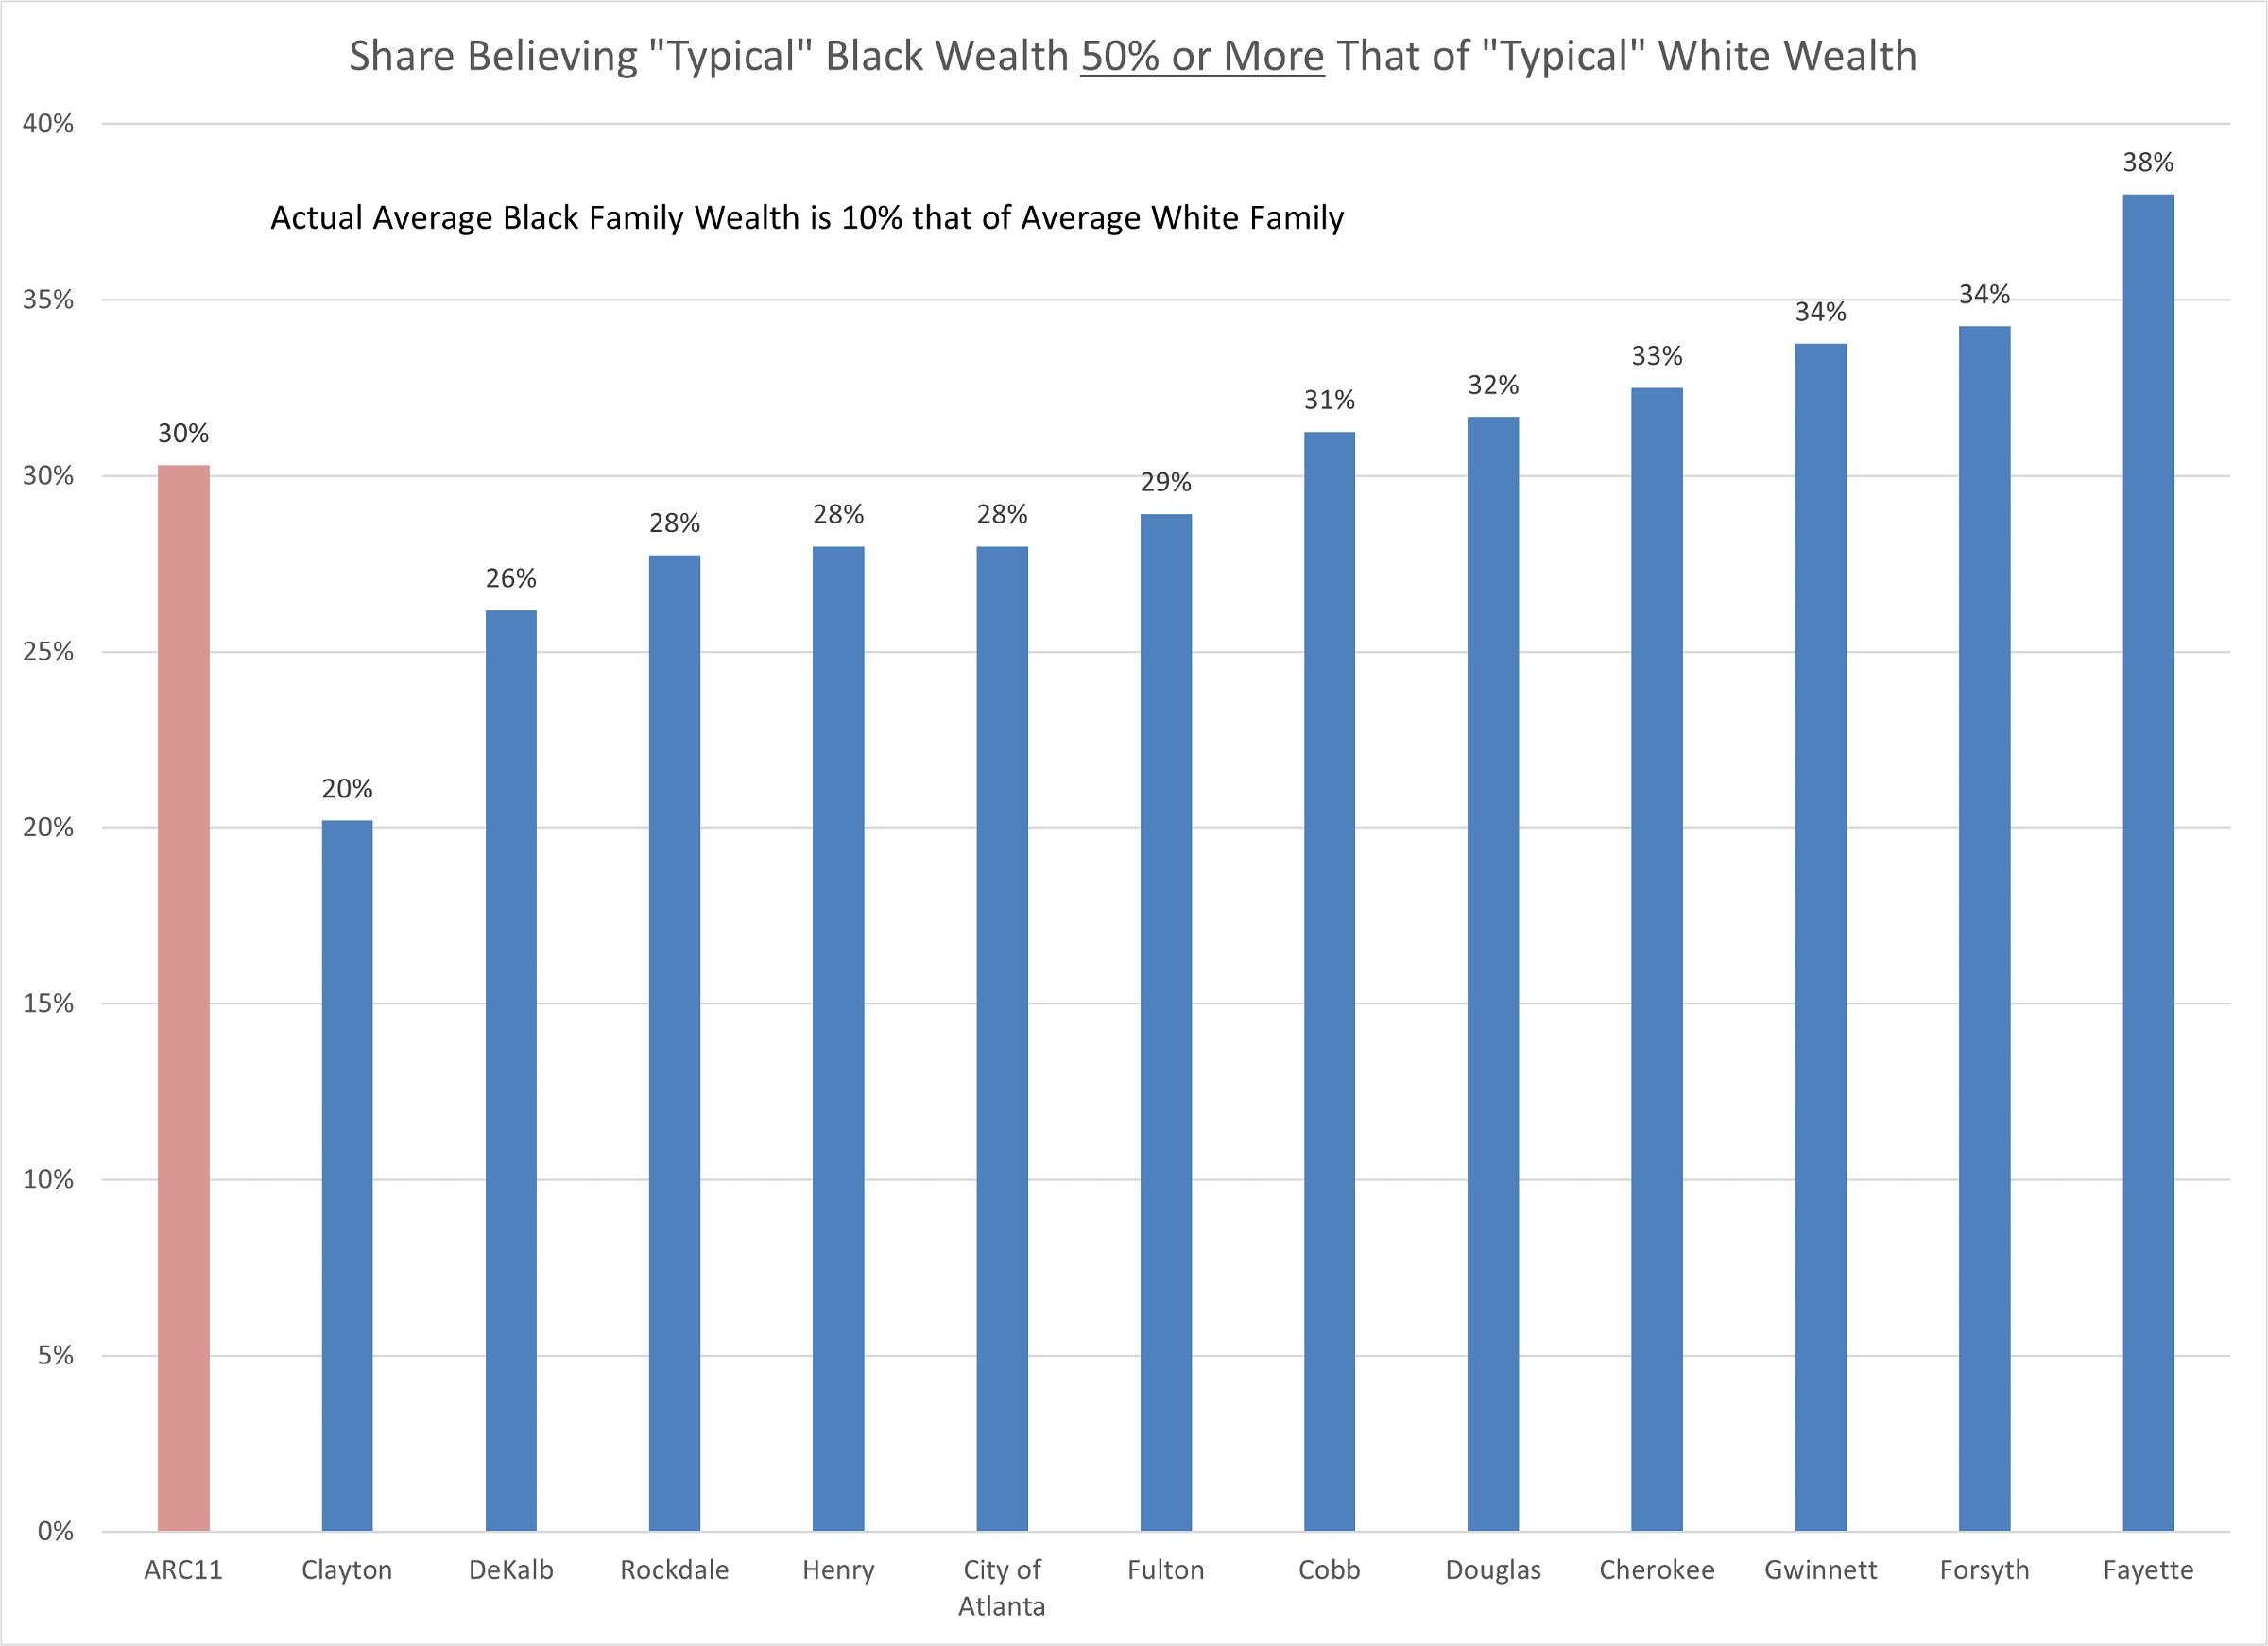
Chart 6: By Race/Ethnicity: Perceived Ratio of Average Black Wealth to White Wealth : MAS 2021
To learn more about Metro Atlanta Speaks and to see more results, visit the following page:
- MAS web page on the Atlanta Regional Commission’s site with highlights, slide decks, the current year’s question list, and the methodology.
- An interactive data dashboard that allows self-exploration and custom querying of most of our dataset for the years 2016 to 2021.
- Our blog post about time trends in perceptions of the region’s biggest problem.

