The economy is firmly top of mind to start 2022 . Indicators are mixed, and a more recent post brought the disturbing finding that our region’s wage gains have lagged inflation rates. Based on those findings, we find it useful and informative to look back at Metro Atlanta Speaks (MAS) respondents’ perceptions of pandemic-era financial stress as of August 2021. The conclusions are inconclusive overall, but on certain topics and in certain areas, remain very concerning. It does seem that food insecurity has increased quite a bit, in most subareas of the region, compared to the levels earlier in the pandemic. And while things have gotten just a little better over the last year (in most subareas) in terms of ability to deal with a $400 emergency and confidence in being able to pay for housing, there are still significant shares of our residents facing difficulties meeting either or both needs.
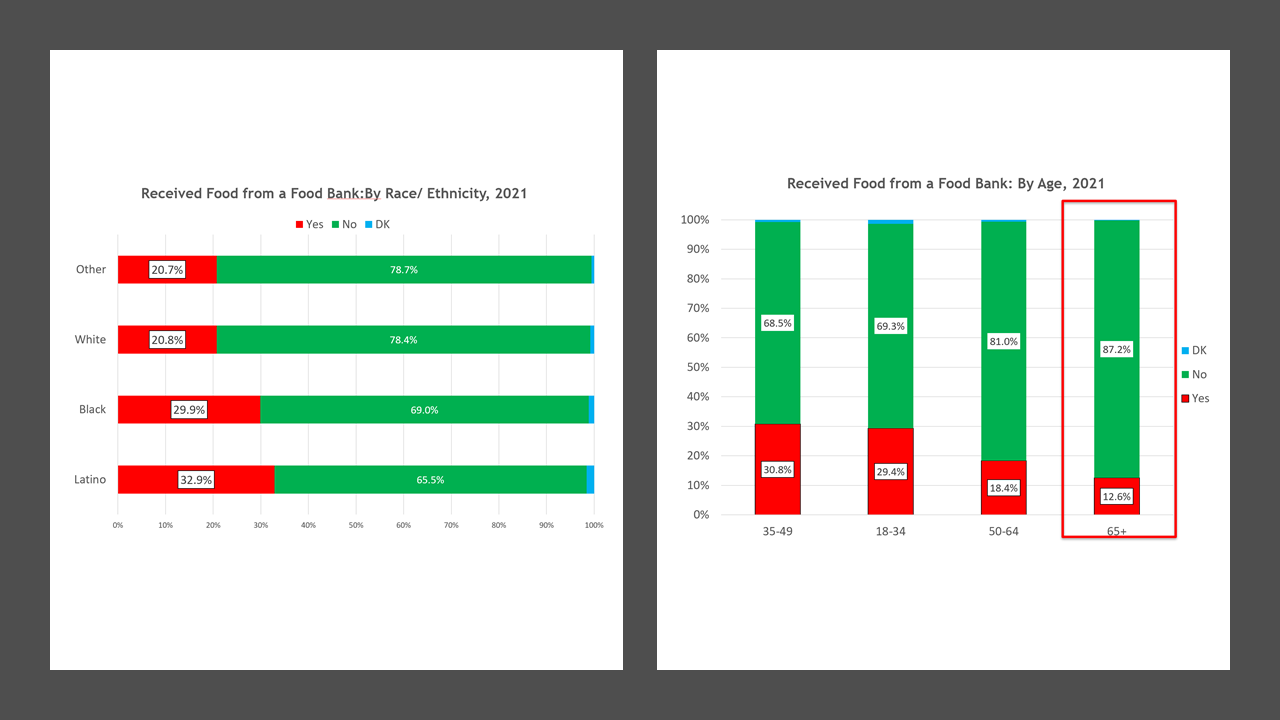
Chart 1a and 1b show that the share of 11-county regional residents choosing to access a food bank increased from under 1 in 5 in 2020 to almost 1 in 4 by August, 2021. As would sadly be expected, in areas with relatively lower median incomes and relatively higher poverty rates (e.g. Clayton and the City of Atlanta) about a third of respondents used a food bank. In the wealthier suburban counties of Fayette and Forsyth, this ratio dropped to close to 1 in 10. Chart 1b provides age and race detail; the younger cohorts are more vulnerable to food insecurity, and nonwhite groups have higher food bank use.
Chart 1a: Metro Atlanta Speaks 2021 Food Insecurity: Time Trend and By County
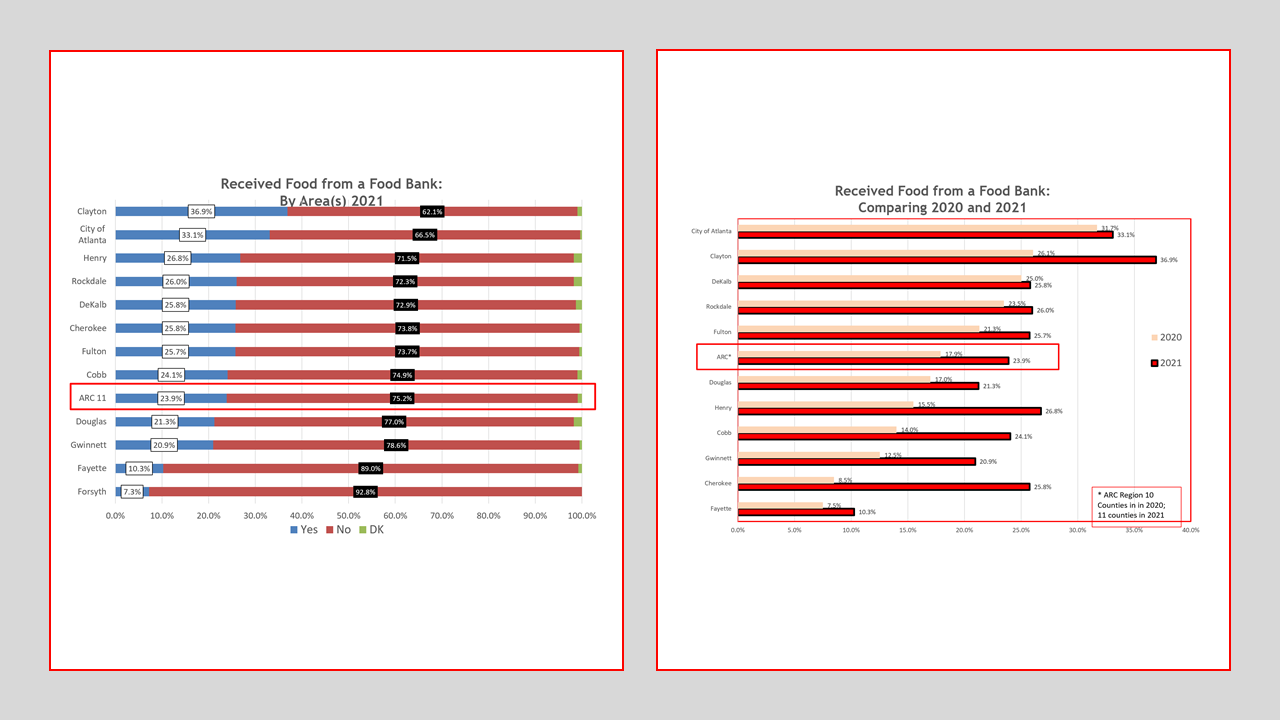
Chart 1b: Metro Atlanta Speaks 2021 Food Insecurity–Race (left) and Age (right) Crosstabs
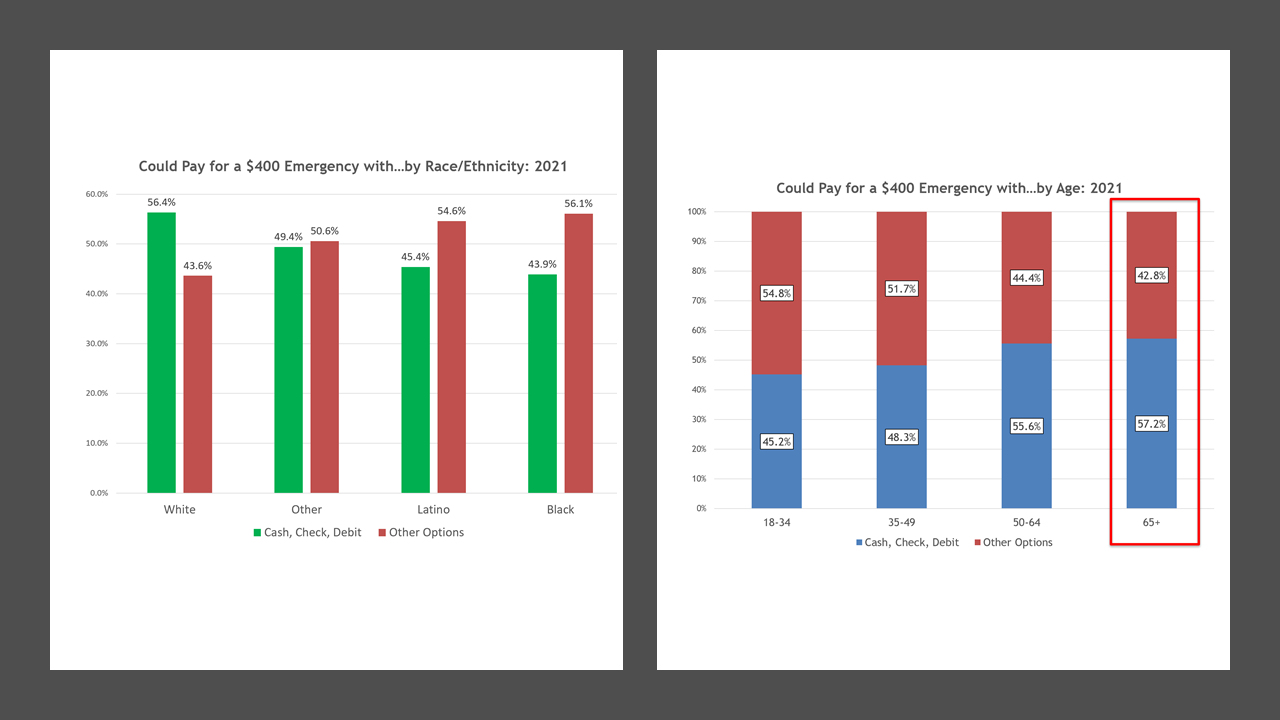
Charts 2a and 2b (below) illustrate the reported capacity of respondents to pay for a $400 emergency expense with cash or debit. In 2a, we can see that at the regional level just over 50% could pay this charge off in 2021 with cash or debit, up very slightly from 2020. 2b reveals that the variation in ability to pay varies less, across race and age, than do the responses about food access. Yet still, the younger cohorts more prone to job loss and with less stable incomes are less likely to be able to pay “with cash”. The white respondents are slightly more likely to be able to pay off a $400 emergency with cash or debit.
Chart 2a: MAS 2021– (Ways of) Paying a $400 Emergency: Time Trend and By County
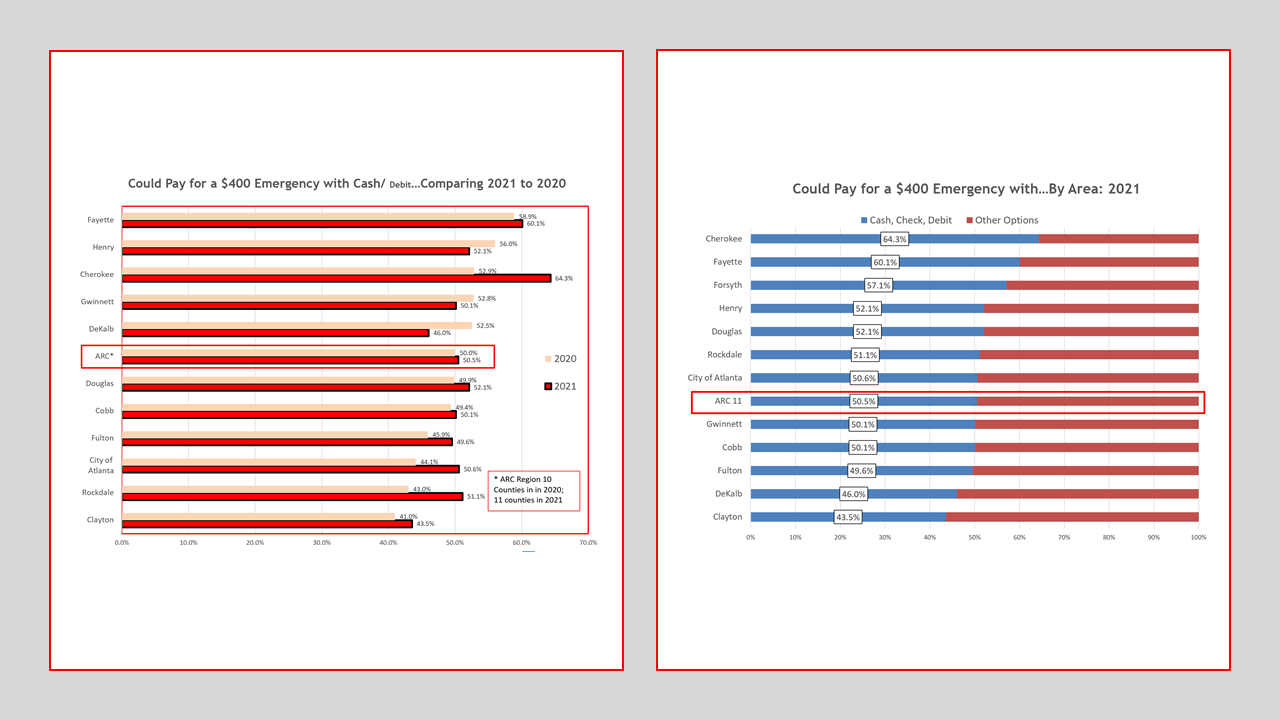
Chart 2b: MAS 2021– (Ways of) Paying a $400 Emergency: Race (left) and Age (right) Crosstabs
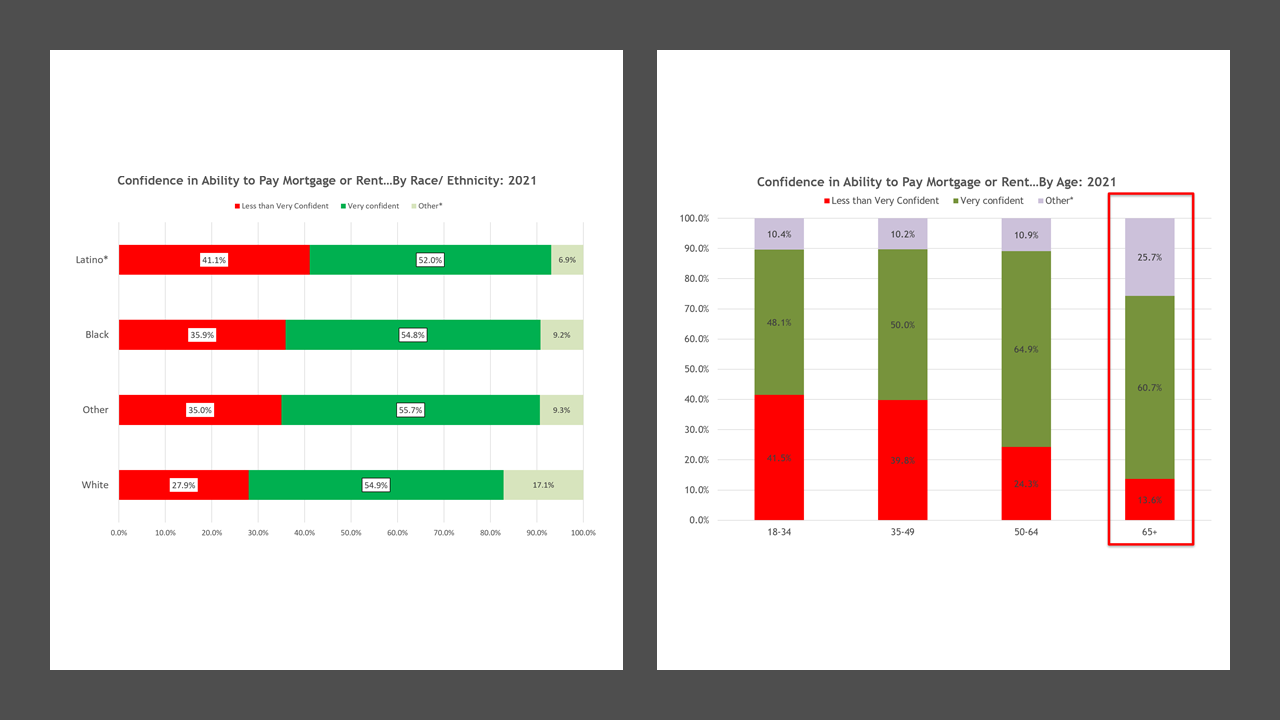
Lastly, we looked more closely at housing insecurity. Charts 3a and 3b suggest that, despite mounting housing prices and constrained supply in the pandemic period, respondents are not much more likely to have lost confidence in their ability to meet their housing expenses. We theorize that stimulus payments, moratoria on evictions and mortgage forbearance may have propped up confidence levels. 3a shows that in all but two counties (Gwinnett and Cobb) the share of households less than very confident in making their next housing payment fell between 2020 and 2021; the greatest declines occurred in some of the areas where housing typically claims a larger share of household income. Consistent with the patterns seen with the $400 emergency question above, younger age groups were relatively more likely to be experiencing housing insecurity, while white respondents were relatively more likely to be confident of being able to make coming housing payments.
Chart 3a: MAS 2021– Housing Insecurity: Time Trend and By County
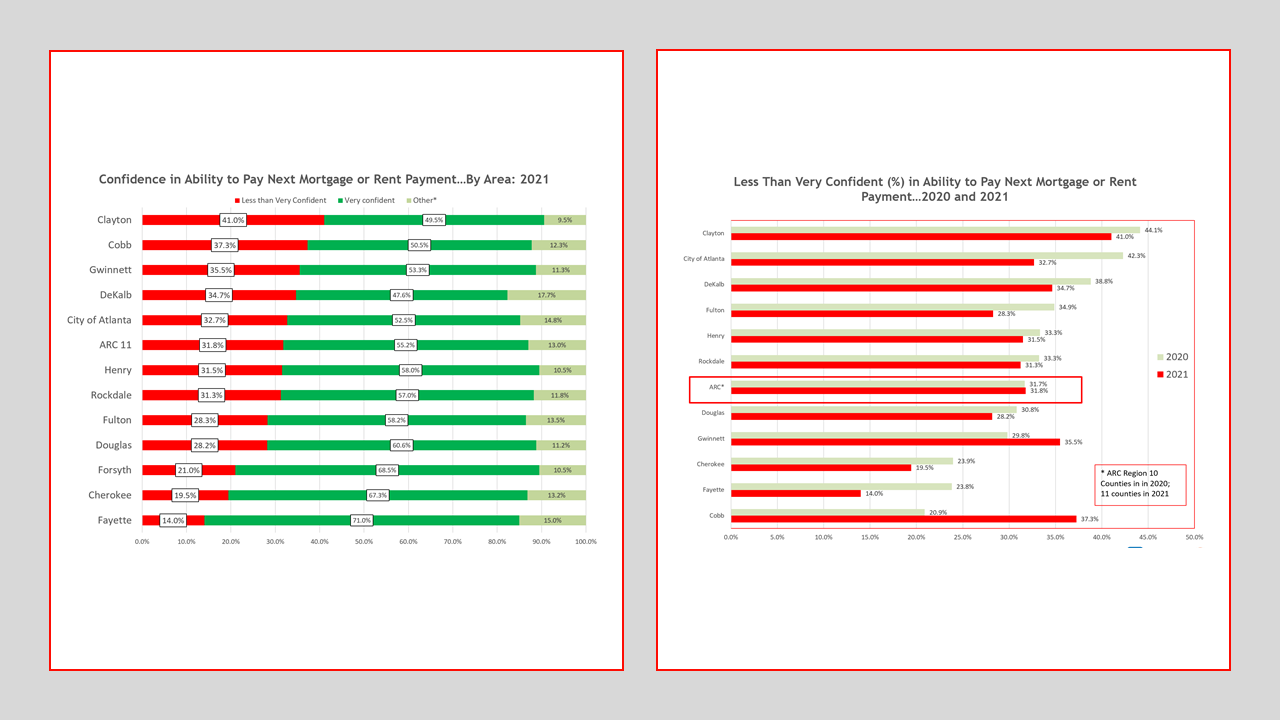
Chart 3b: MAS 2021– Housing Insecurity: Race (left) and Age (right) Crosstabs
To close with some reminders, this post is one of many analyses already emergent from MAS 2021. There is an MAS web page on the Atlanta Regional Commission’s site with highlights, slide decks, the current year’s question list, and a methodology. There is an interactive data dashboard that allows self-exploration and custom querying of most of our dataset from 2016 to 2021. There is also a post out on time trends in perceptions of the region’s biggest problem.

