Data on recent and speculation about future movement in wages and inflation have been all over the media in the last two months. Putting our recent economic overview together got us wanting to take a closer look at the data for these indicators, and to pull out key findings.
Wages have increased to record highs. But to get a true picture of the real trend in wages. we have to adjust for inflation, which has been going up dramatically as well. When we do that, the story begins to shift quickly. Check out Chart 1 below. Workers in cities like Los Angeles and Dallas win big, as wage growth exceeds that of inflation, which means there is “real” wage growth. But Atlantans lag behind their peers. The size of the inflation adjustment can be seen as the difference between the gross and real income bars in the graphic.
Chart 1: Change in Real Wages By Metro (Average Hourly Wages adjusted for Inflation, base 1/2018); Source: U.S. BLS

Still considering Chart 1 above, we see that, since 2018, real wages nationally have grown modestly– by about 3.1%. Areas such as Washington, D.C. and New York mirror this level of growth. The story in Atlanta is very different though–it is in fact the only metro area analyzed where real wages have decreased. Atlanta’s industry mix (a relatively high share of services jobs) and higher than average inflation in our area in 2021 may be partly responsible for this drop in real wages.
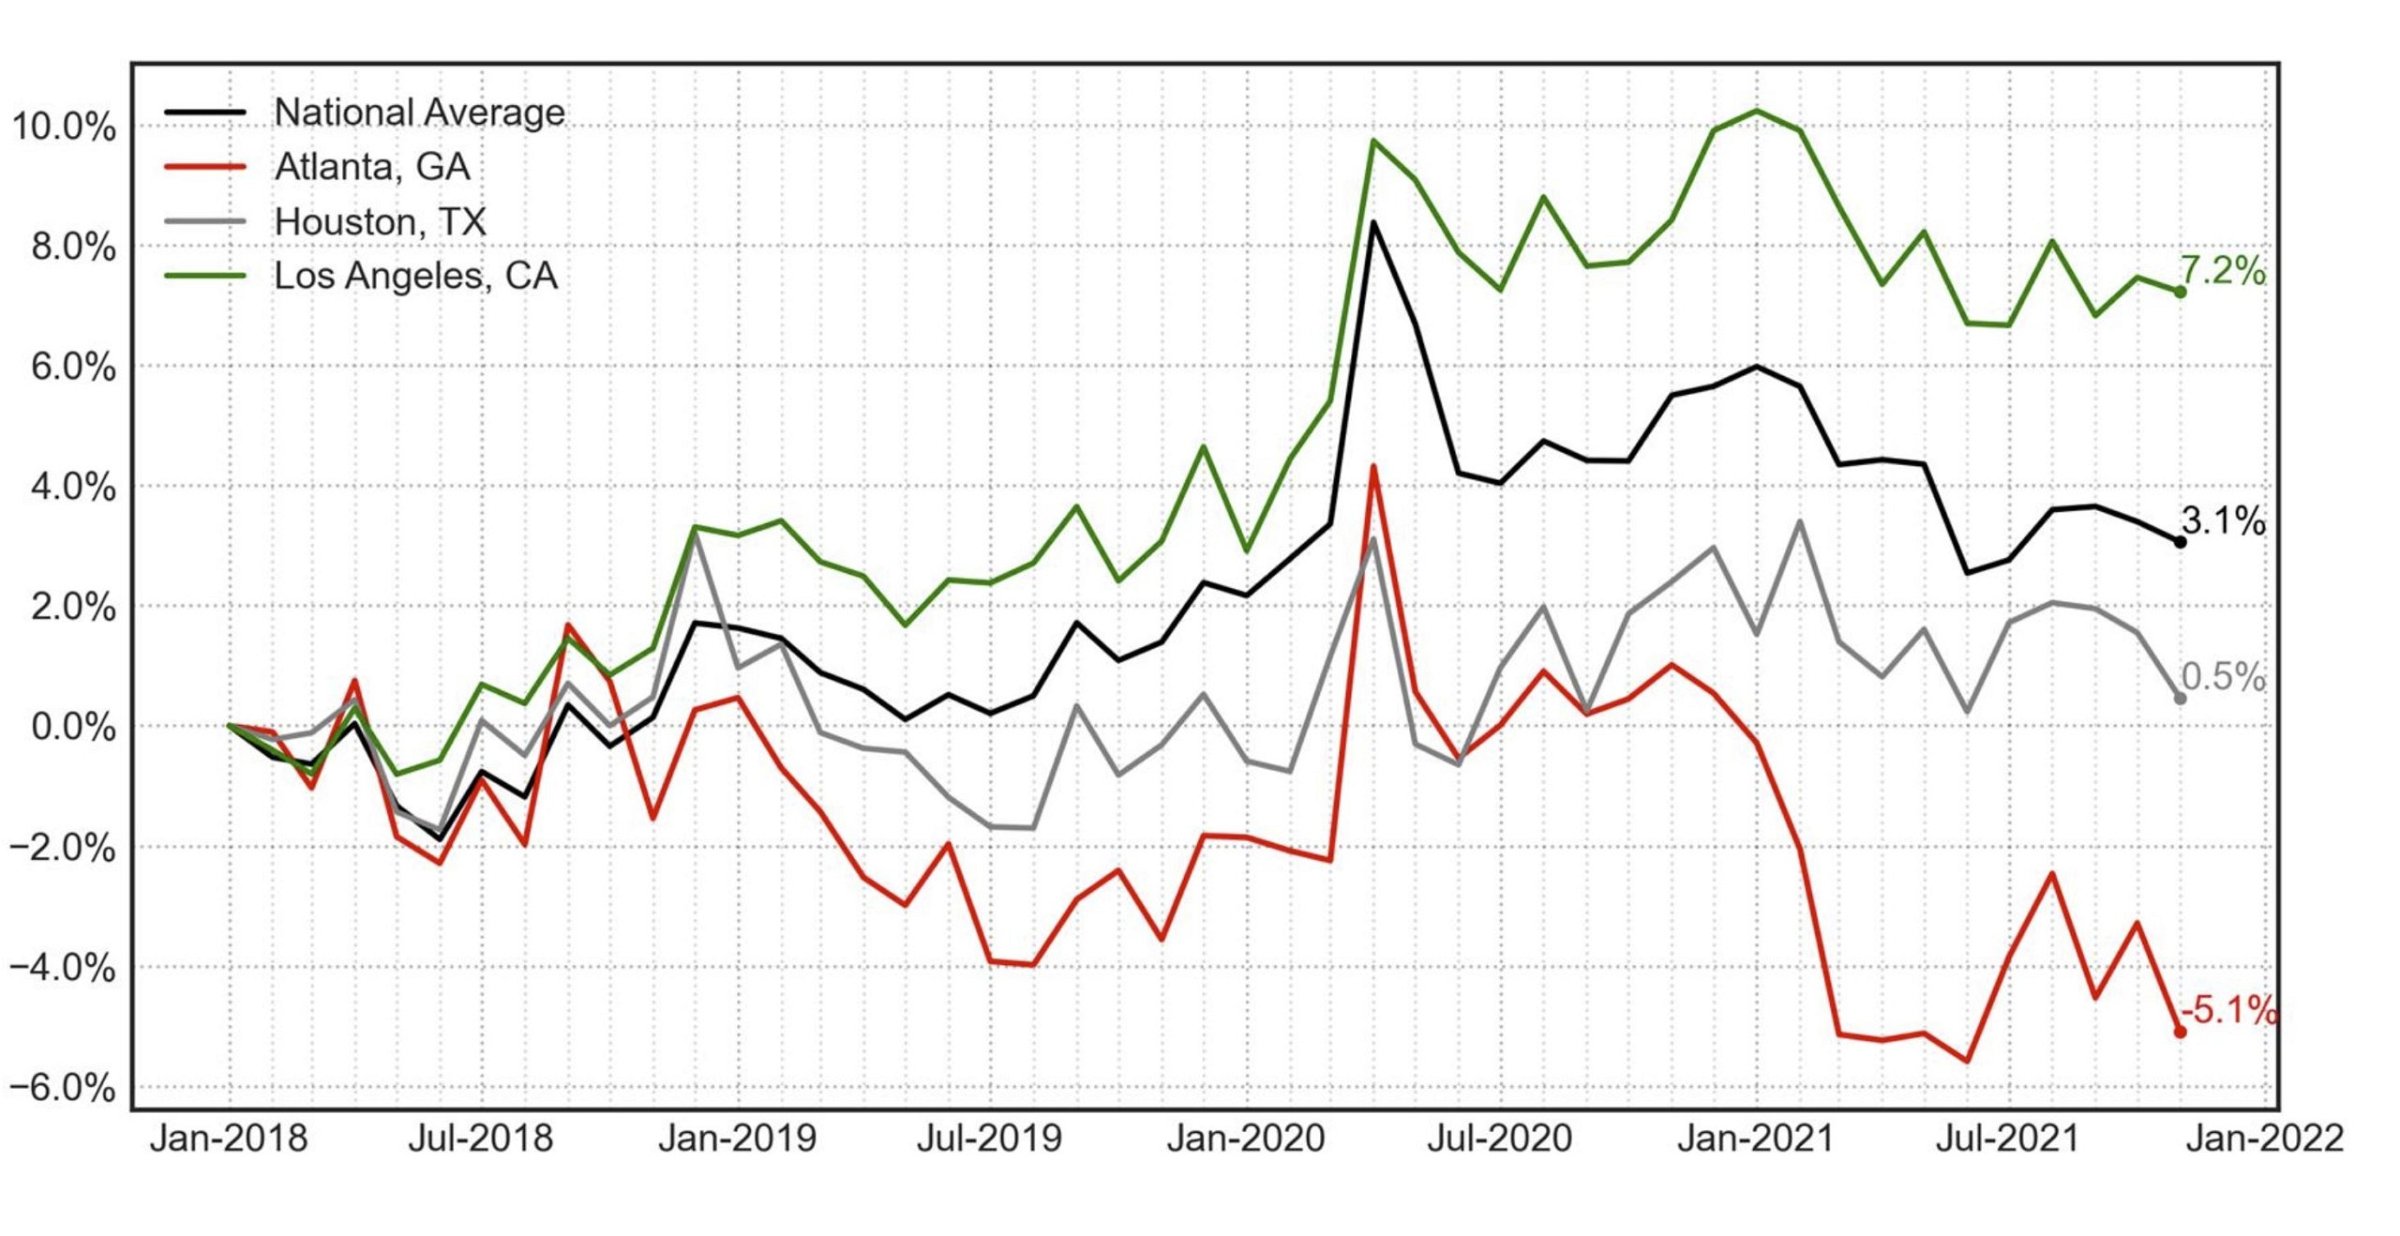
Chart 2: Percent Real Average Hourly Earnings Growth (since 2018); Source: U.S. BLS

Chart 2 above takes a more detailed view of real wage growth, and it reveals that Atlanta real wages began to lag long before the higher inflation levels building during the pandemic period. Between January 2018 and July 2019 Atlanta wages fell 4% while other metros experienced steady wages or small deviations. Houston was only down 1% during this time. The gap between real wages in Atlanta and in other metros increased by a lot in the course of 2021. Higher than average inflation combined with lackluster wage growth led to a large 5.1% decrease in real wages.
Chart 3: Year Over Year Changes in Real Average Hourly Wages; Source: BLS

The year over year analysis of Chart 3 (above) tells a very similar story. Atlanta wages have been on the decline in 2018 and 2019, but there was modest growth during the pandemic. This may be due to a large portion of lost jobs during the pandemic coming from low wage sectors (those service sectors we mentioned earlier) and might not reflect the overall well-being of the economy. Across the country we see very significant declines in real wages in 2021– largely due to the historically high levels of inflation.

