“Owning your own home” has often been equated with “the American Dream”–although there is strong debate about whether the dream might be a desirable one. More inarguable is that homeownership has almost always been a major source of generational wealth for owners, across all racial and ethnic groups. And most all of us have heard about the recent price run-ups during the pandemic economy. But homeownership rates (and price run-ups) have been far from equal across races and ethnicities. Thus, in Black History Month, taking a look at the relative trends in Black homeownership rates is a reasonable proxy for starting to assess any improvements in wealth equity (or a lack thereof).
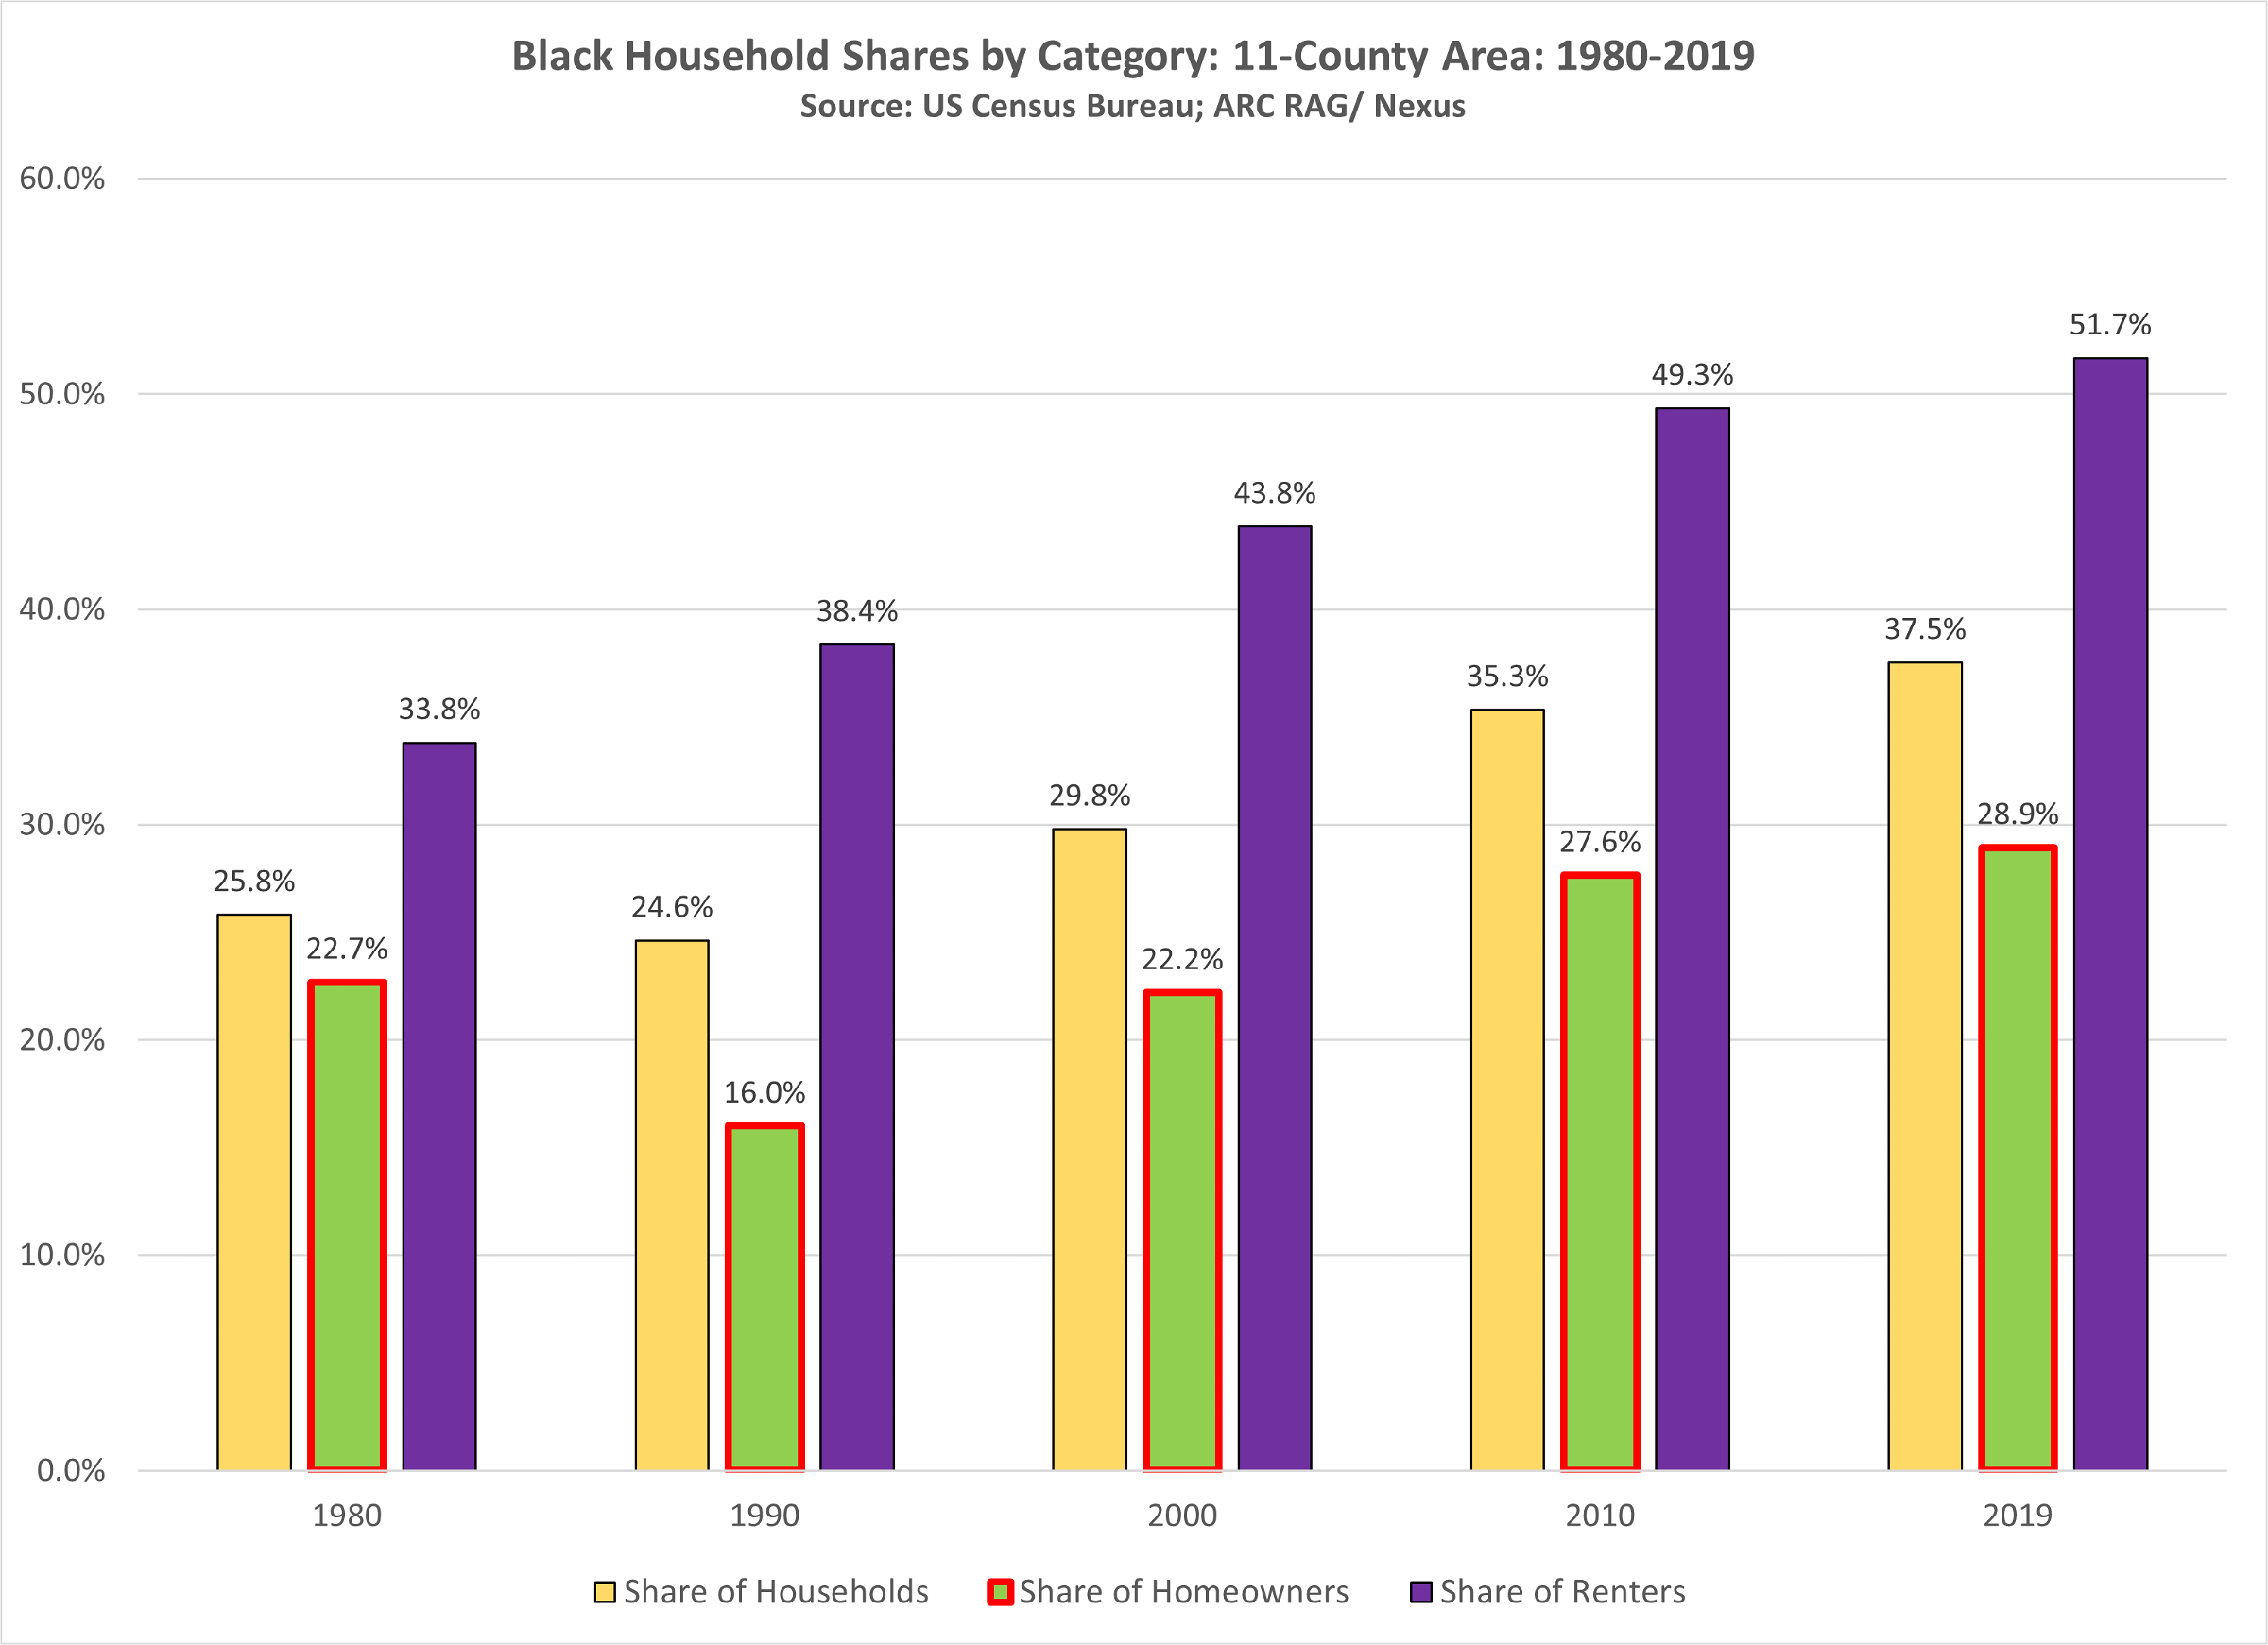
Chart 1 below shows that Black households increased to 1 in 3 of all regional (ARC 11-county) households in 2019, from just over 1 in 4 of all households in 1980. Four decades ago, Blacks were 1 in 3 of 11-county regional renters, but in 2019, they represented over half of the households renting across the 11 counties. Finally, the ownership ratio (Blacks as a share of all owners) began at about 1 in 5 regionally in 1980, then dropped to about 1 in 6 at the start of the 1990s, but increased steadily through the next two decades to hit almost 3 in 1o by 2019.
Chart 1: Black Household Shares in the 11-County ARC Region: 1980-2019 (Source: US Census Bureau; ARC RAG/ Nexus)

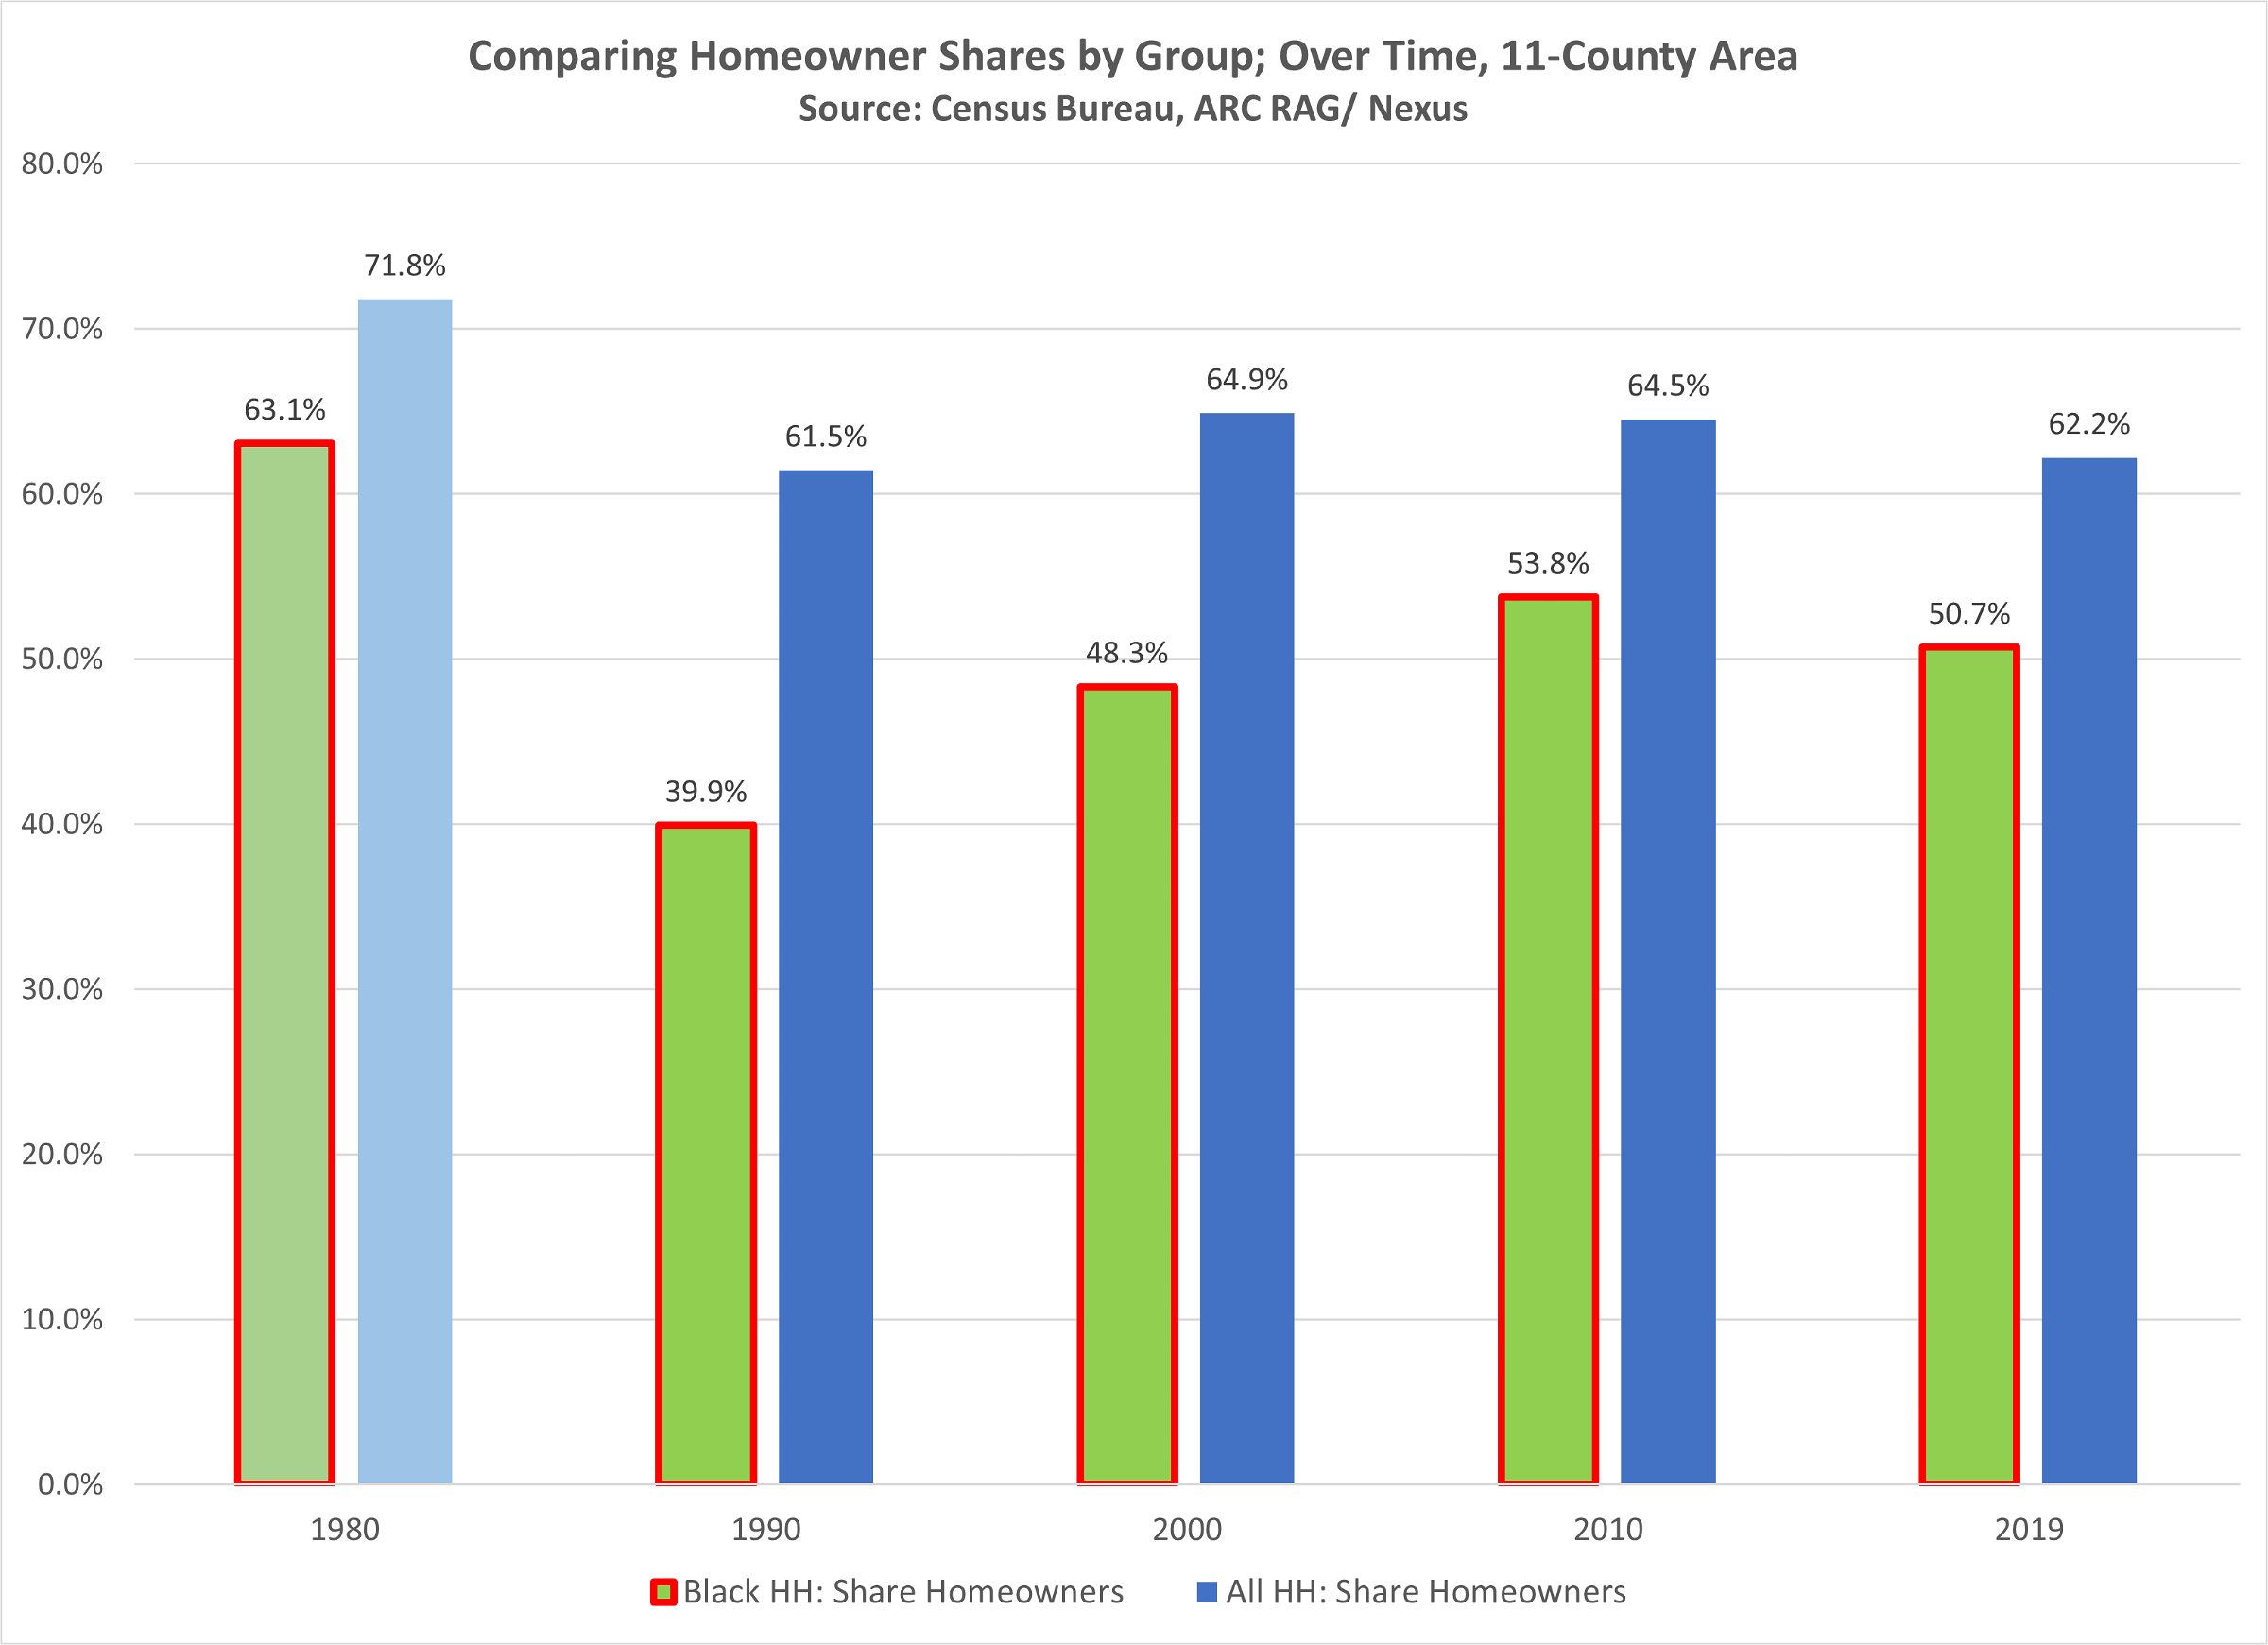
Chart 2 does show, however, that the increasing share of Black ownership (among Black households) has not resulted in a leveling with the homeownership rate of the overall population. The owner share differences by race widened from 1980 to 1990, likely as Black population began to surge in the metro area–driven by job-based in-migration of younger households less likely to own. There was nearly a 22 percentage point gap in 1980–a 61% owner share overall vs. 39% share in the Black household group. Yet this gap declined dramatically to just over 10 percentage points by 2010 (i.e. an owner rate of 64.5% overall to 53.8% share owned among Black households). However, with the 2010s, any more narrowing of the gap seems to have stalled out, as there have been slightly declining homeownership rates overall.
Chart 2: Homeowner Shares by Group Over Time, 11-County Area (Source: Census Bureau, ARC RAG/ Nexus)

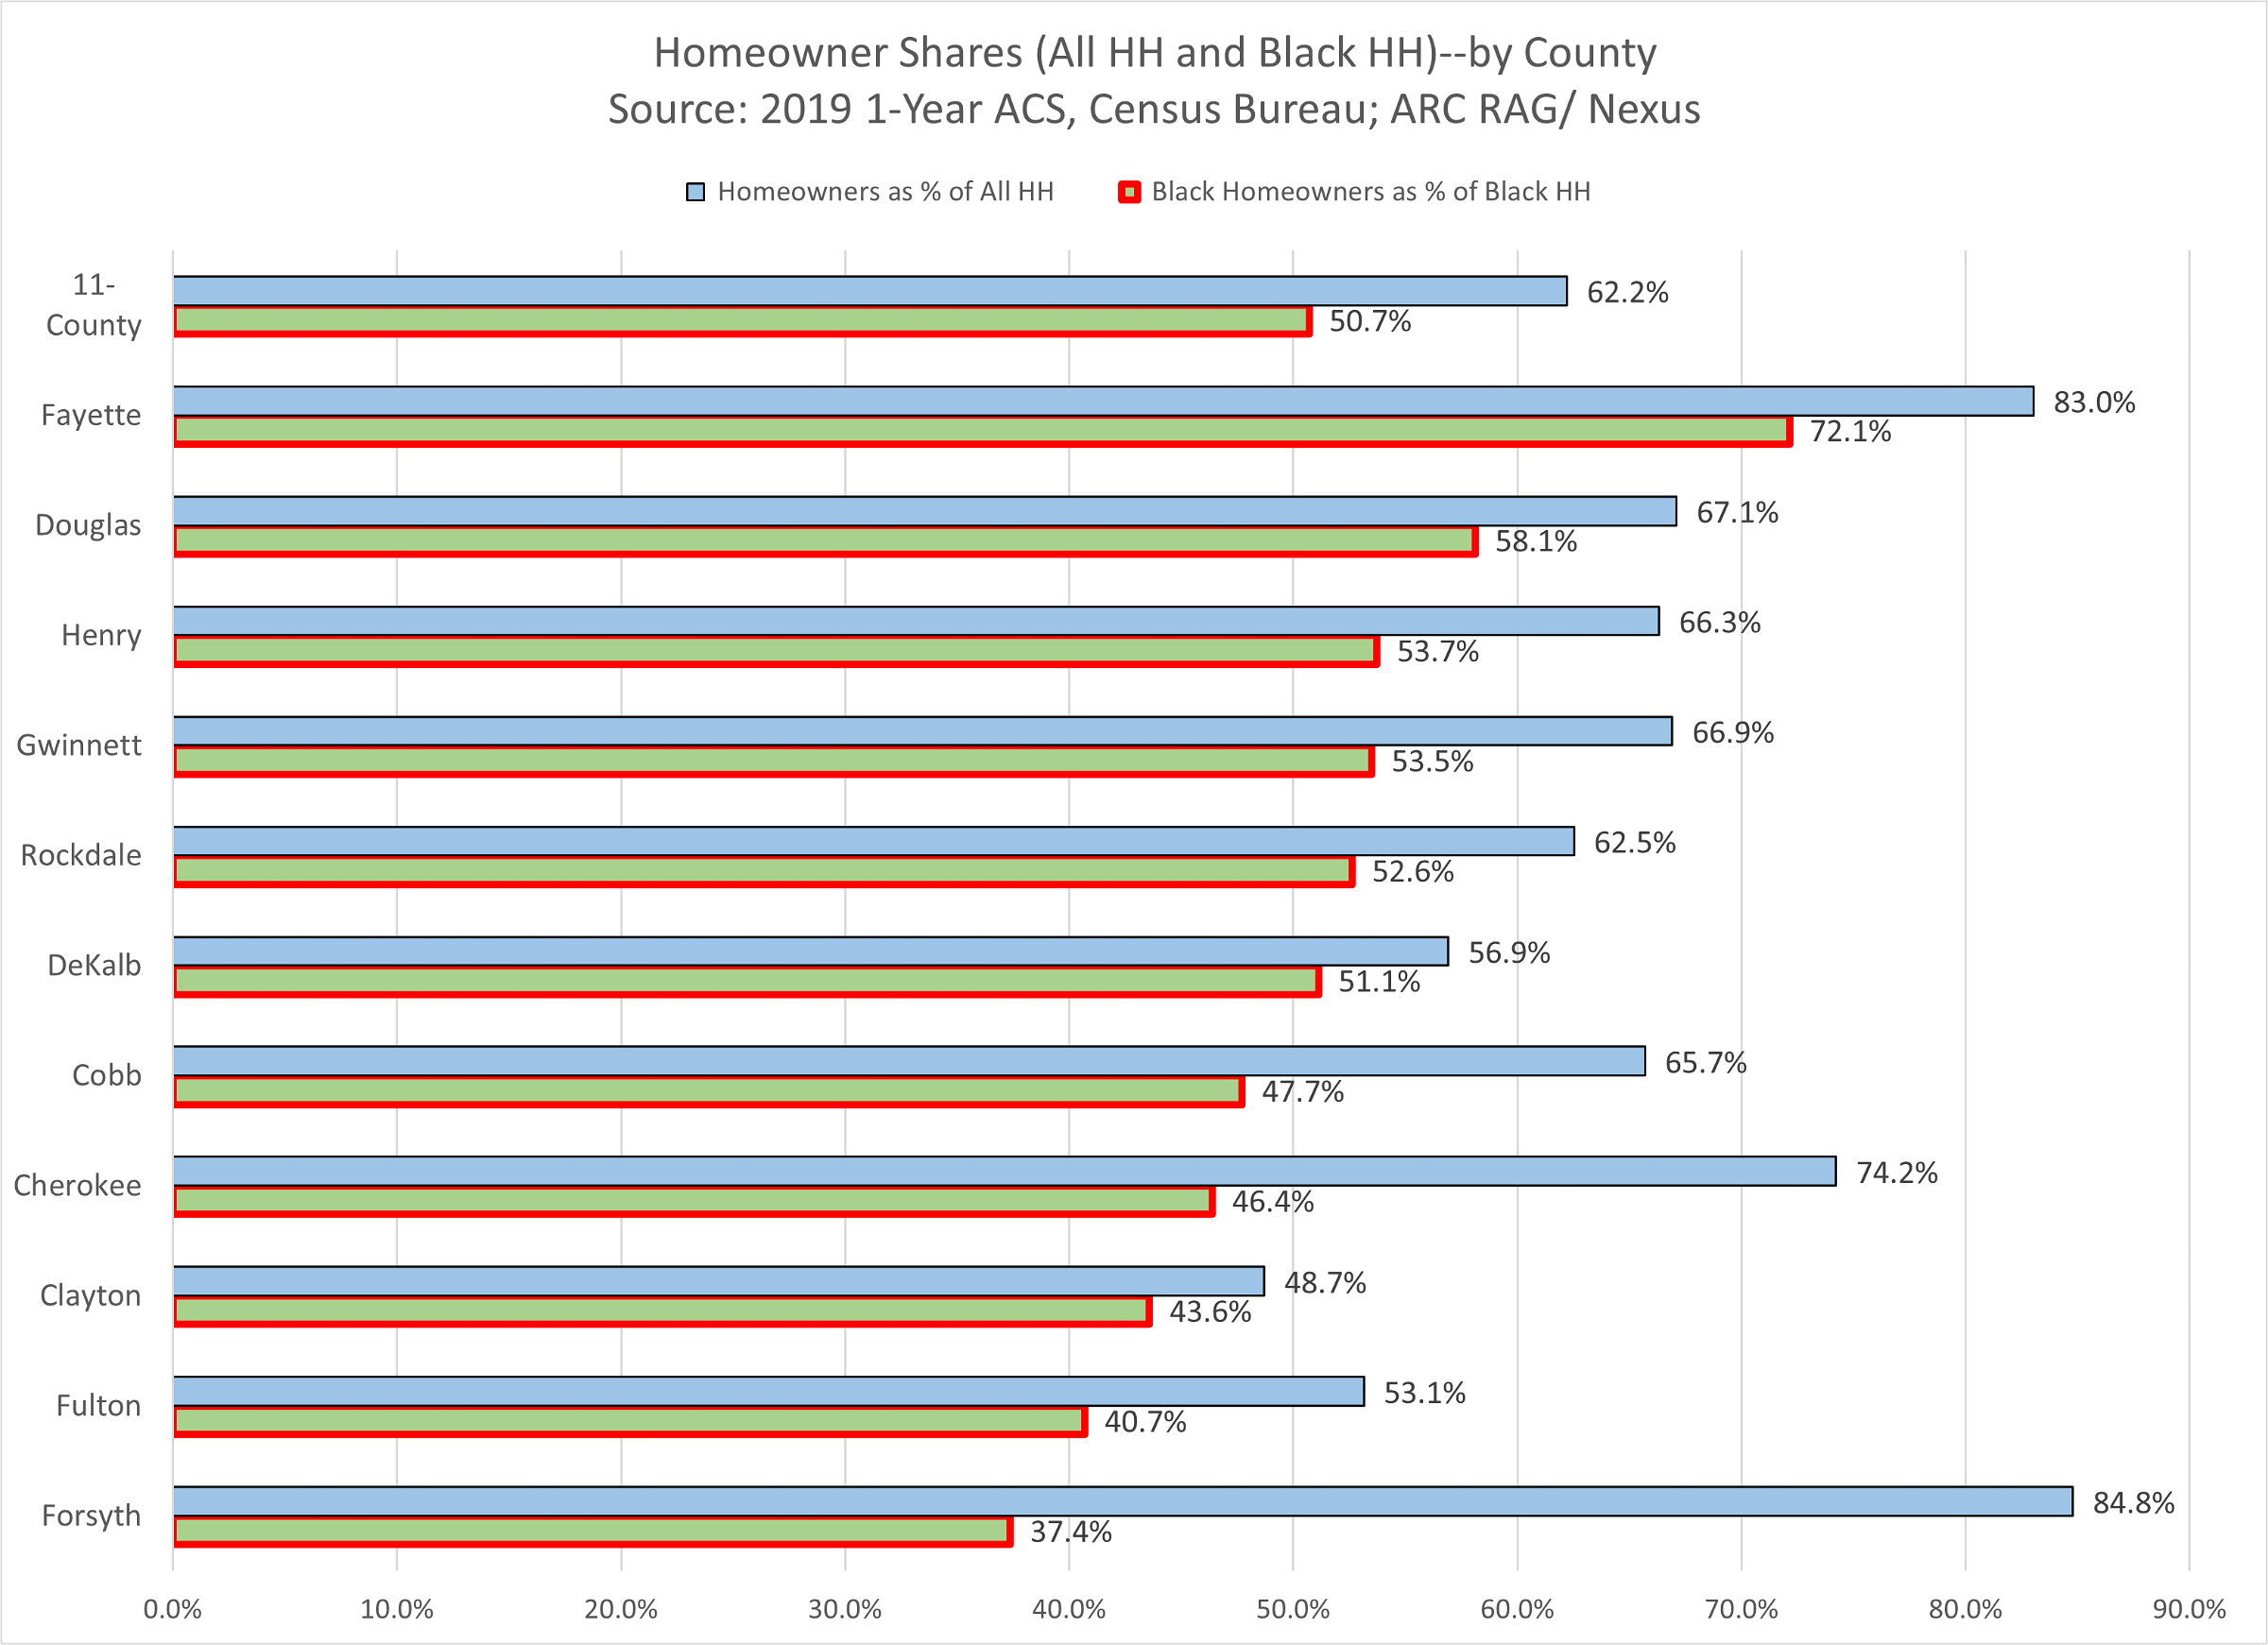
Dropping down to the county level in Chart 3 (below) tells a more nuanced story. The two top bars show the 11-county discrepancy as noted above. In a few of the counties with larger shares of Black populations, such as DeKalb and Clayton, the Black homeownership gap is narrower than the regional average (less than 10 percentage points). And yet the homeownership rates are low, in general, in both those counties. Fayette is the highest income county across all races and ethnicities, and there nearly 3 in 4 of Black households own their own home. But in the suburban counties of Cherokee and Forsyth, also higher-income and with smaller shares of Black population, the gap widens (between “all” and “Black” owner shares) to over 30 percentage points.
Chart 3: Comparing Homeowner Shares in 2019 by Area–for Black and Total Populations (Source: US Census, ARC)


