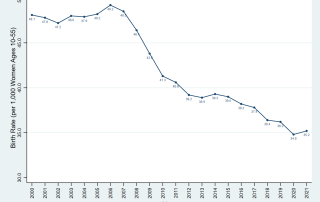
Birth Rates: The Stork Stalls
Birth rate declines pose challenges for maintaining anything close to historic averages for population growth.

Birth rate declines pose challenges for maintaining anything close to historic averages for population growth.
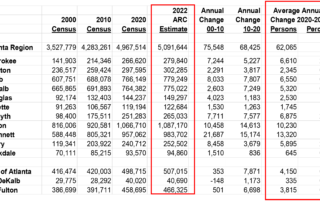
ARC's 2022 population estimates find that the region had a better growth this year than last year...find out how much better, and why...
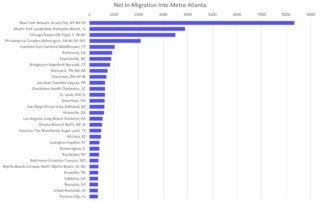
Population migration to and from Atlanta: which metros are the "givers" and "takers" ?
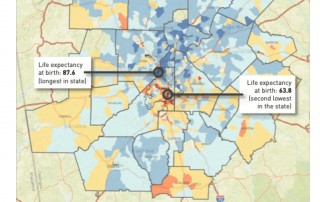
This month's regional snapshot provides an overview of opportunities and challenges, with related demographic data, for our senior population.
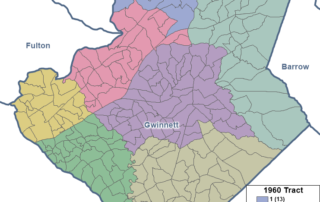
We take a close look at the past and present of census tracts, a key reporting unit for Census data--and critical geography for figuring out (along with those data) eligible areas for grant funding.
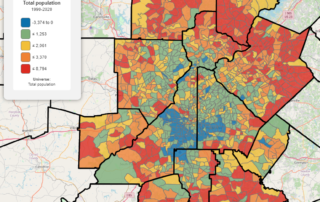
Taking a closer look at thirty years of neighborhood population growth, decade by decade!
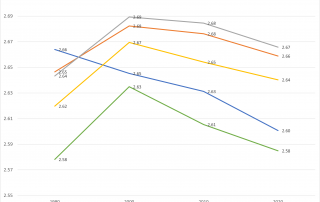
Population growth is declining recently, but what's happening to household size? Well, a little bit of everything, depending on where you look
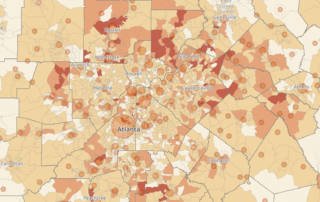
Insights on demographic changes at the tract and city level, along with an interactive map allowing you to explore more.
We close our population decline series with a review of factors and an overview of recent Census Bureau estimates, along with the first-issued results of the 2020 Census, which appear to indicate that we are headed for at least a few years of slowing growth.
This month's regional snapshot provides a detailed overview of senior demographics (historic trends and likely future), andl presents the latest data on pandemic-related and other public health challenges. for these age groups.