Any visitor to the 33N blog, Data Nexus, or most federal government data websites will at some point encounter data expressed in terms of “Census tracts”. It can be confusing because tracts seem to follow their own logic rather than conforming to more familiar geographies like city boundaries.
For example, Figure 1 below depicts the northern boundary of the City of Atlanta and its correspondence (or lack thereof) to Census tract boundaries.
Figure 1: Comparing City of Atlanta Northern Boundary and Census Tracts

This divergence is actually an intentional feature of tracts, rather than a “bug”, or error of any type. A quick look at the origin of Census tracts will explain why they often don’t match up with city limits.
In the early 20th century, Dr. Walter Laidlaw was conducting population research for the New York Federation of Churches using Census data tabulated to State Assembly districts. But New York redrew its State Assembly boundaries in 1905, which created a problem for him. Laidlaw wanted to examine change over time, but the geographic units would not be comparable. So he proposed to the Census Bureau that permanent boundaries be drawn and that data be tabulated to these new boundaries. The Census Bureau worked with leaders in eight major cities to create such districts, ultimately called tracts, for the 1910 Census. The idea caught on, and the process of delineating tracts continued over the remainder of the century.
Atlanta’s tracts were drawn in 1936. And at the time, they conformed perfectly to the city’s boundaries. The only trouble is, as you see below in Figure 2, the city of Atlanta in 1936 (dark shading) was very different from Atlanta in 2020!
Figure 2: City Boundaries: Atlanta in 1936 Compared to Atlanta in 2020

To sum up the spatial changes we see in Figure 2 above– as the City of Atlanta annexed land and grew, its city limit boundary diverged more and more from the tract boundaries, precisely because the goal of census tracts was to create small-area spatial areas that did not change– change much, that is (read on).
So, how do Census tracts get defined, then? They nest perfectly into counties and never cross county lines. The Census Bureau mandated that tracts be delineated by local committees of people familiar with the area. The areas were to range in size from 2,500 to 8,000 people, with about 4,000 being the minimum average size. Tracts were also to be drawn following permanent, visible boundaries, with an eye toward uniformity of size and to be “fairly homogeneous with respect to racial characteristics and economic status.”
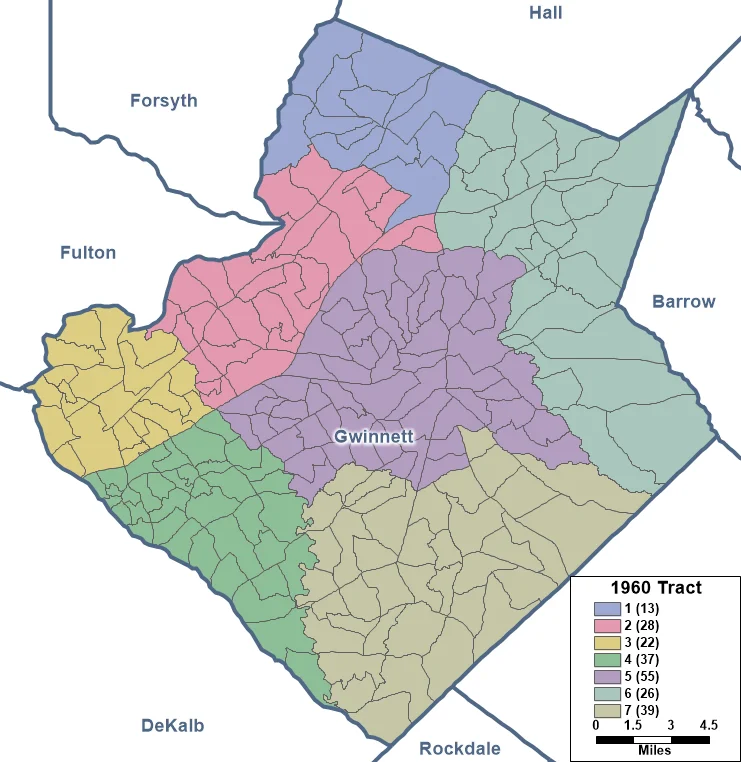
Can tract boundaries change? Yes. Despite the stated goal of defining tracts that would be permanent, this has not always been possible. Tracts are re-examined every decade in conjunction with the decennial Census, but most boundaries remain stable over time. The most common changes are splits due to population growth. For example, tracts for Gwinnett County were first delineated for the 1960 Census. Check out Figure 3 below. At the time, the county had a total population of 43,541, and as such, was divided into only seven tracts (represented by the different color shading in Figure 3). Fast forward to 2020, and Gwinnett County had become the second most populous county in the state with a total population of 957,062, and is now divided into 220 tracts (see the dark lines below subdividing the colored areas into many more smaller subareas). Each of Gwinnett’s 2020 tracts is numbered between 501 and 507, followed by a decimal point and two additional digits (e.g., 501.05). All of the tracts with 501 before the decimal point were part of that original Gwinnett tract number 1 (Buford and environs); tracts with 502 were all part of Gwinnett tract number 2 (the area around Suwanee and Duluth), and so on. Thus, it remains possible to examine change over time despite the splits.
Figure 3: Gwinnett County Census Tracts: 1960 to 2020

It is also possible, though much less common, for two tracts to be merged due to population loss. Tract boundaries rarely change beyond the splitting and merging, though other changes can occur if the visible feature used to define the boundary no longer exists. For instance, a stream could run dry, or railroad tracks could be taken up.
In conclusion, Census tracts are a really useful geographic unit that allow exploration of data below the county level in a manner that can be compared over time. Thanks to their homogeneity at the time of creation, their consistent population size, and the fact that they were drawn with input from local experts, some researchers use tracts as a stand-in for neighborhoods in areas where a better alternative is not available. And they are used by government agencies to define areas eligible for funding under certain programs. For example, income eligibility requirements for Freddie Mac’s Home Possible program depend on the Census tract where the property is located. Similarly, Census tracts are used to define Medically Underserved Areas, which are eligible for programs such as special J-1 visa waivers for foreign physicians.
References
Census Tract Manual, Third Edition, Revised and Enlarged. U.S. Census Bureau, 1947.
Geographic Areas Reference Manual. U.S. Census Bureau, 1994.
Permanent Census Tracts: Greater Atlanta. WPA Project No. 65-34-4083, 1936.
U.S. Censuses of Population and Housing: 1960 Final Report PHC(1)-8 Census Tracts, Atlanta, Ga. Standard Metropolitan Statistical Area, 1961.

