Data Diversion: Mike and Mike Discuss the Economic Impacts of COVID-19
In this recording of an Atlanta Regional Commission Webinar, the agency's Mike Alexander and Mike Carnathan dissect the intersection of the public health crisis and the economy.

In this recording of an Atlanta Regional Commission Webinar, the agency's Mike Alexander and Mike Carnathan dissect the intersection of the public health crisis and the economy.
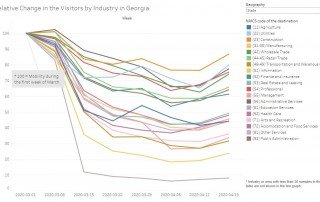
This post finds that the amount of regional travel to most industry destinations within the region has declined since early June, and median travel distances in all counties have declined at a slightly lower rate. Trips and trip distances do remain well above the levels seen during the statewide shelter-in-place order.
The U.S. Census Bureau's Community Resilience Estimates offer an opportunity to learn which communities may need the most attention both during the pandemic and in the nationwide recovery that will take place once its passed.
COVID-19 cases in nursing homes are on the rise, and a Supreme Court decision from 1999 provides the groundwork for getting people out of an institutionalized setting and into their homes, where they can engage in better social distancing and safety from the virus.
This post looks at pandemic impacts on the spending of lower-income metro residents.
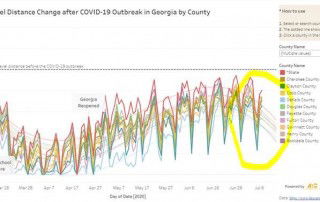
An update to our social distancing dashboard, using data from the month of May.
Travel within the region had a marked decline (for good reason) during the statewide shelter-in-place order. This post explores what's happened to local travel since Georgia's reopening.
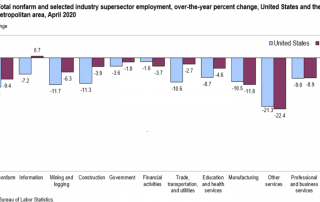
The pandemic has already led to job loss in the most vulnerable occupations (and has even spread to other job sectors). Following job loss through a household's budget leads to more bad economic and social outcomes for those families. Decreased affordability of housing is an example. This Data Diversion provides an initial look at data that frame potential housing impacts of COVID-associated job loss.
So we've posted recently about mobility during COVID-19--how we have traveled less and when those declines happened. This week, we use the same data source (Safegraph) to look at how and when our pandemic-period mobility changes vary by industry sector.
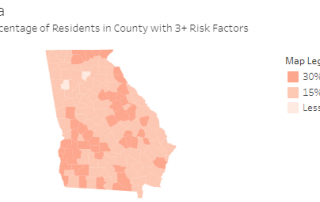
While the medical and public health communities continue to work towards flattening the curve for COVID-19 infections, data continues to show that older adults may be at higher risk for severe illness from coronavirus. A few weeks ago on this blog, we provided information on the spatial distribution of the senior population in Georgia: https://33n.atlantaregional.com/monday-mapday/monday-mapday-older-populations [...]