Regional Snapshot: 2021 Metro Atlanta Speaks in Summation
Metro Atlanta Speaks...we have given you most of the rest (v.v. tools to view the information), now check out the best (summary, that is).



Metro Atlanta Speaks...we have given you most of the rest (v.v. tools to view the information), now check out the best (summary, that is).
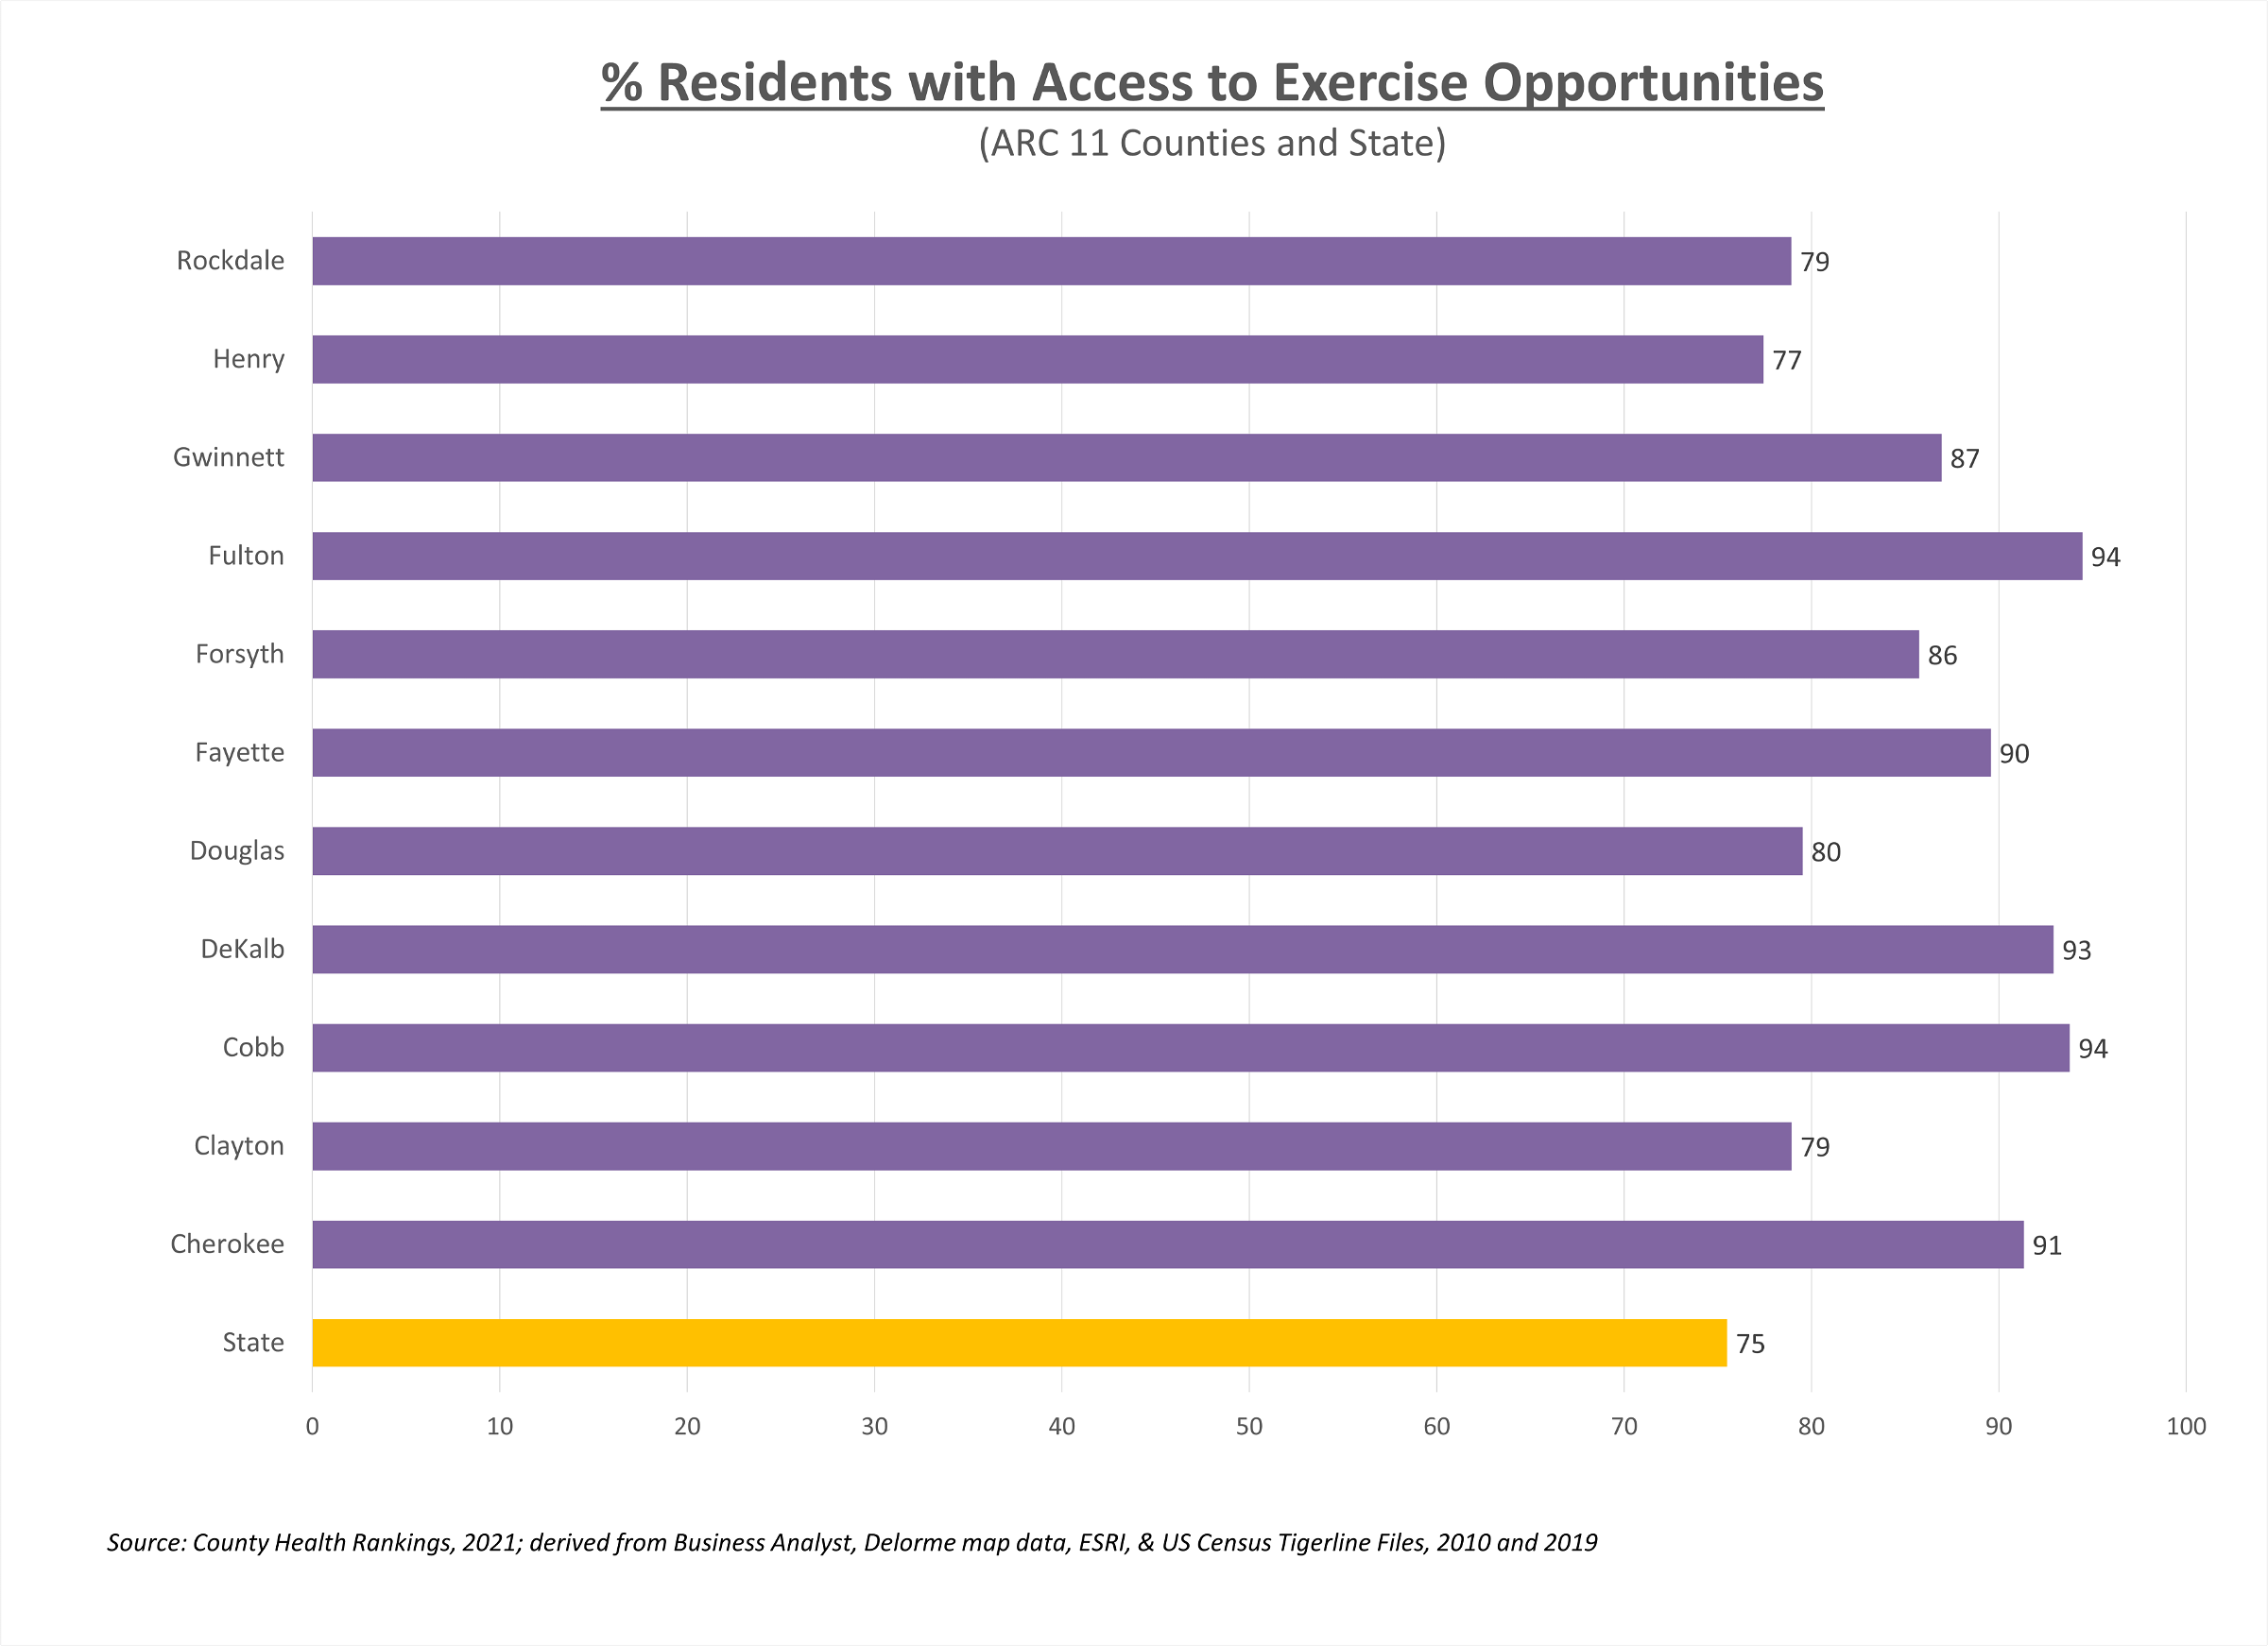
With the holiday indulgence season here, we're offering a look at how our counties measure up on healthy behaviors year-round.
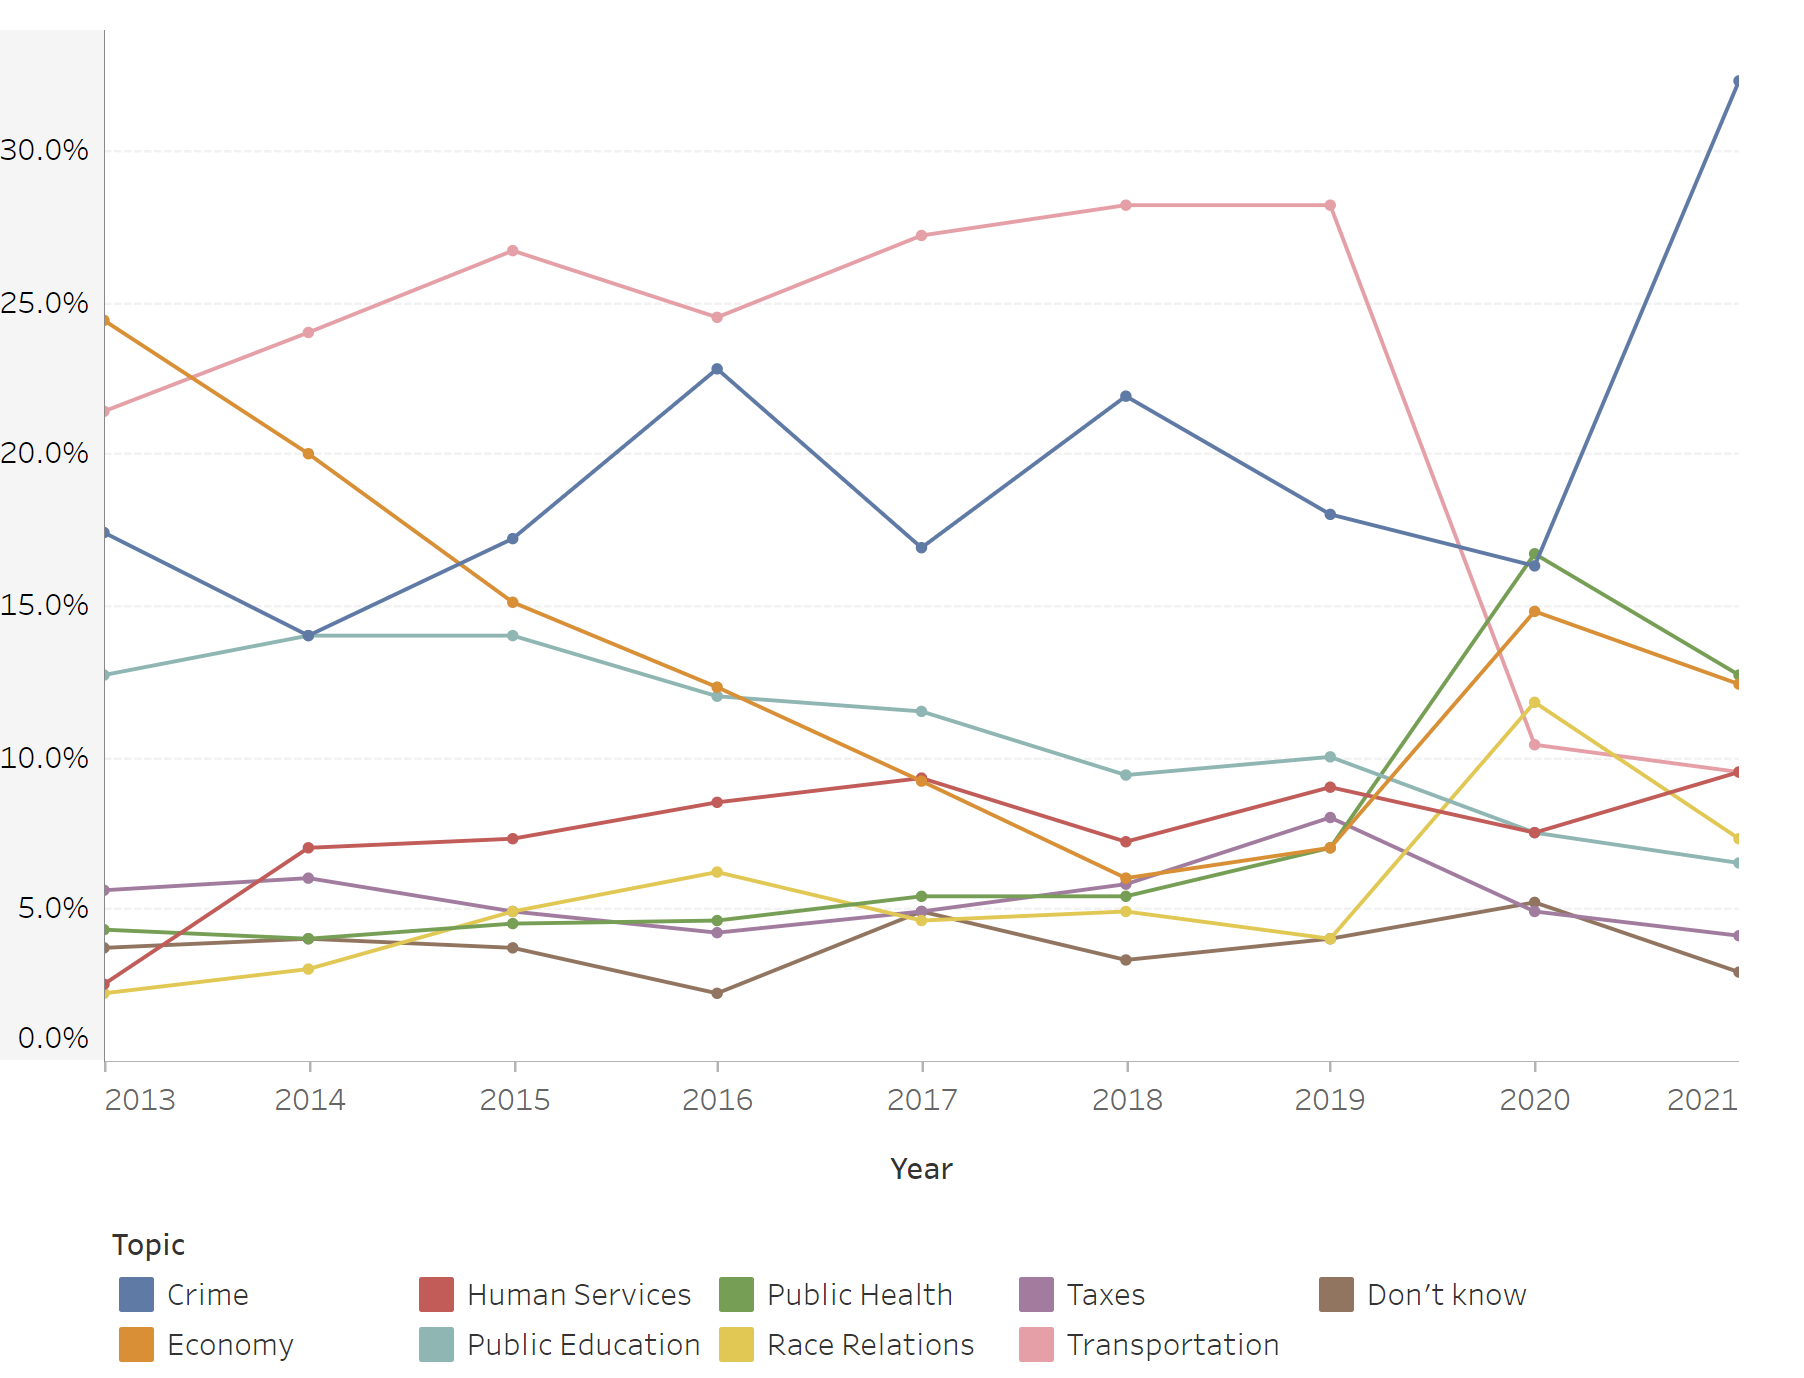
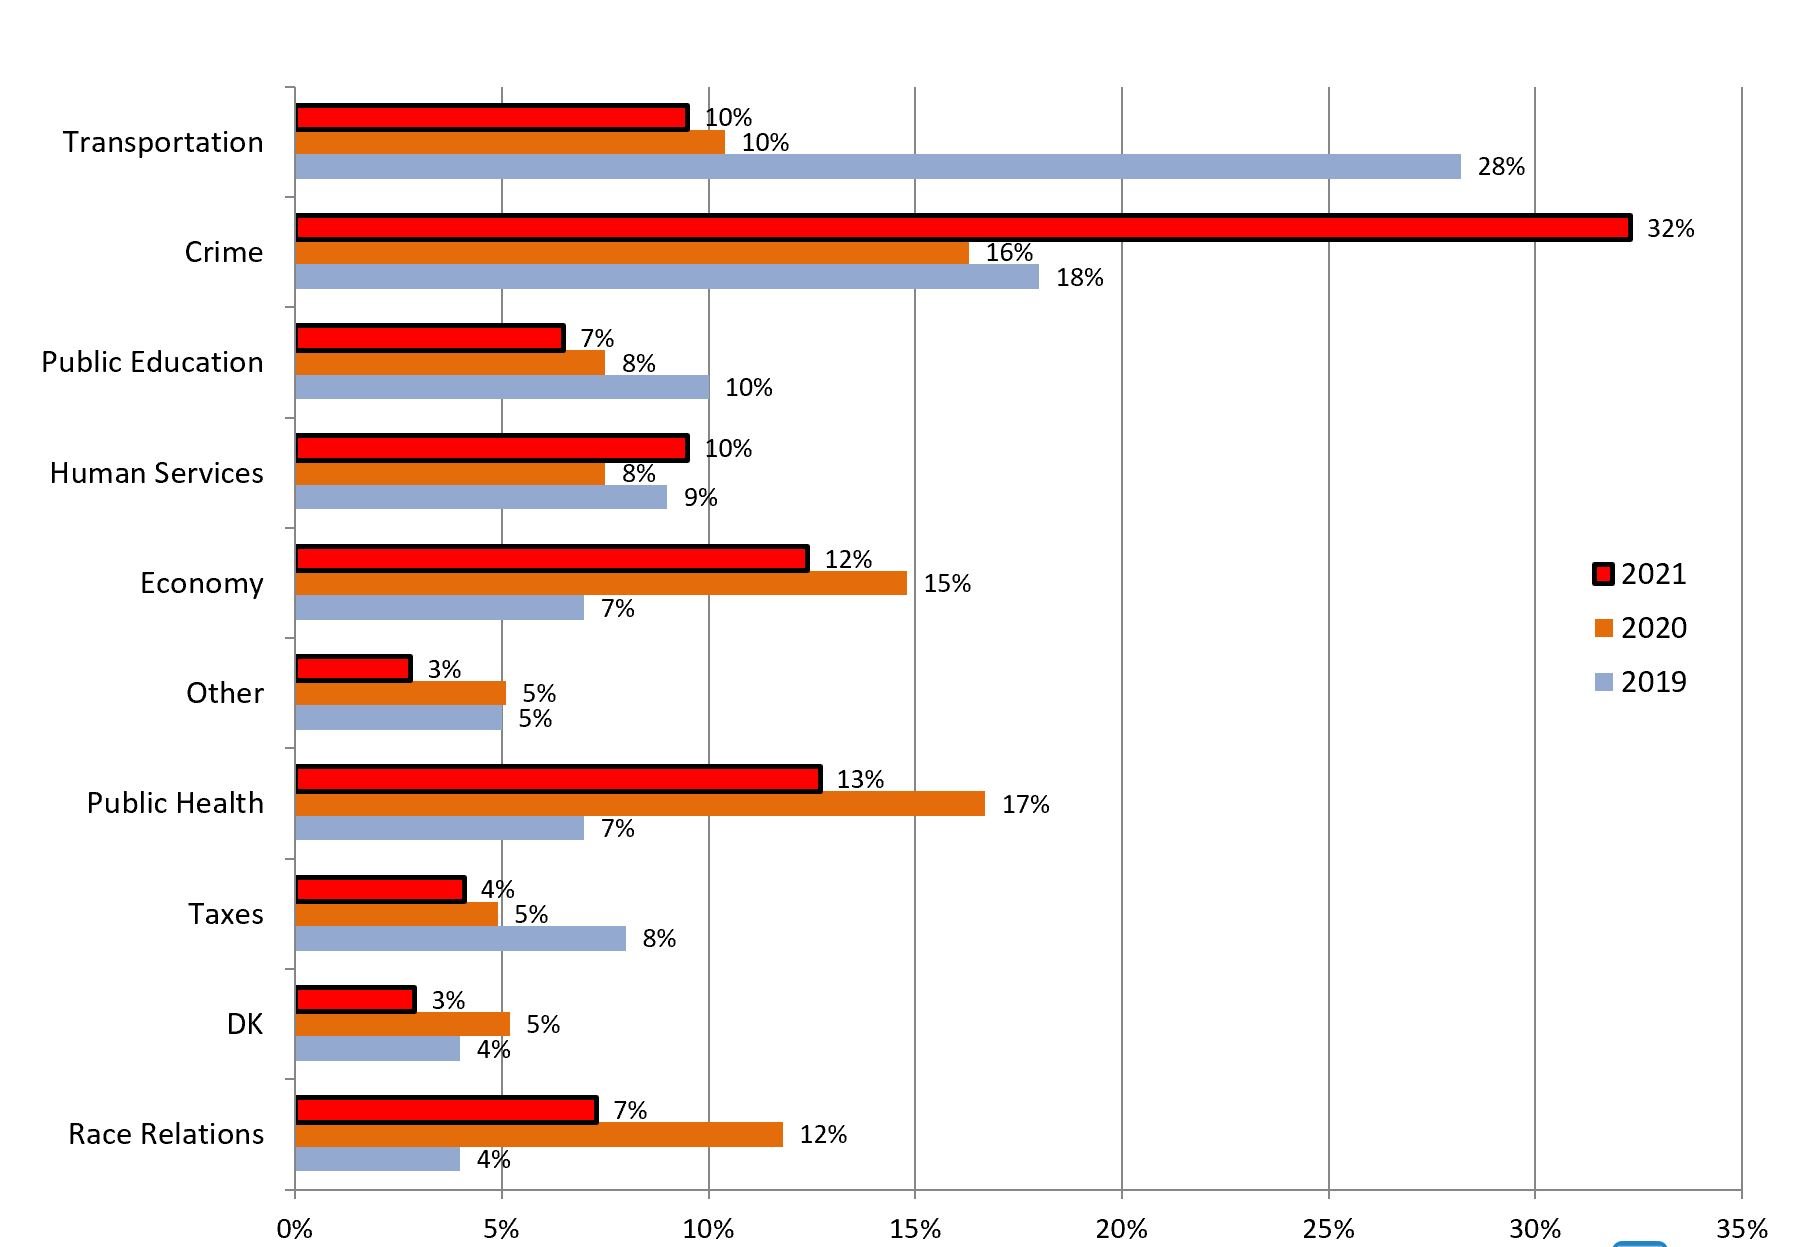
What's the Biggest Problem? How the answers to the biggest question in the Metro Atlanta Speaks Survey have changed over time - and how they haven't.
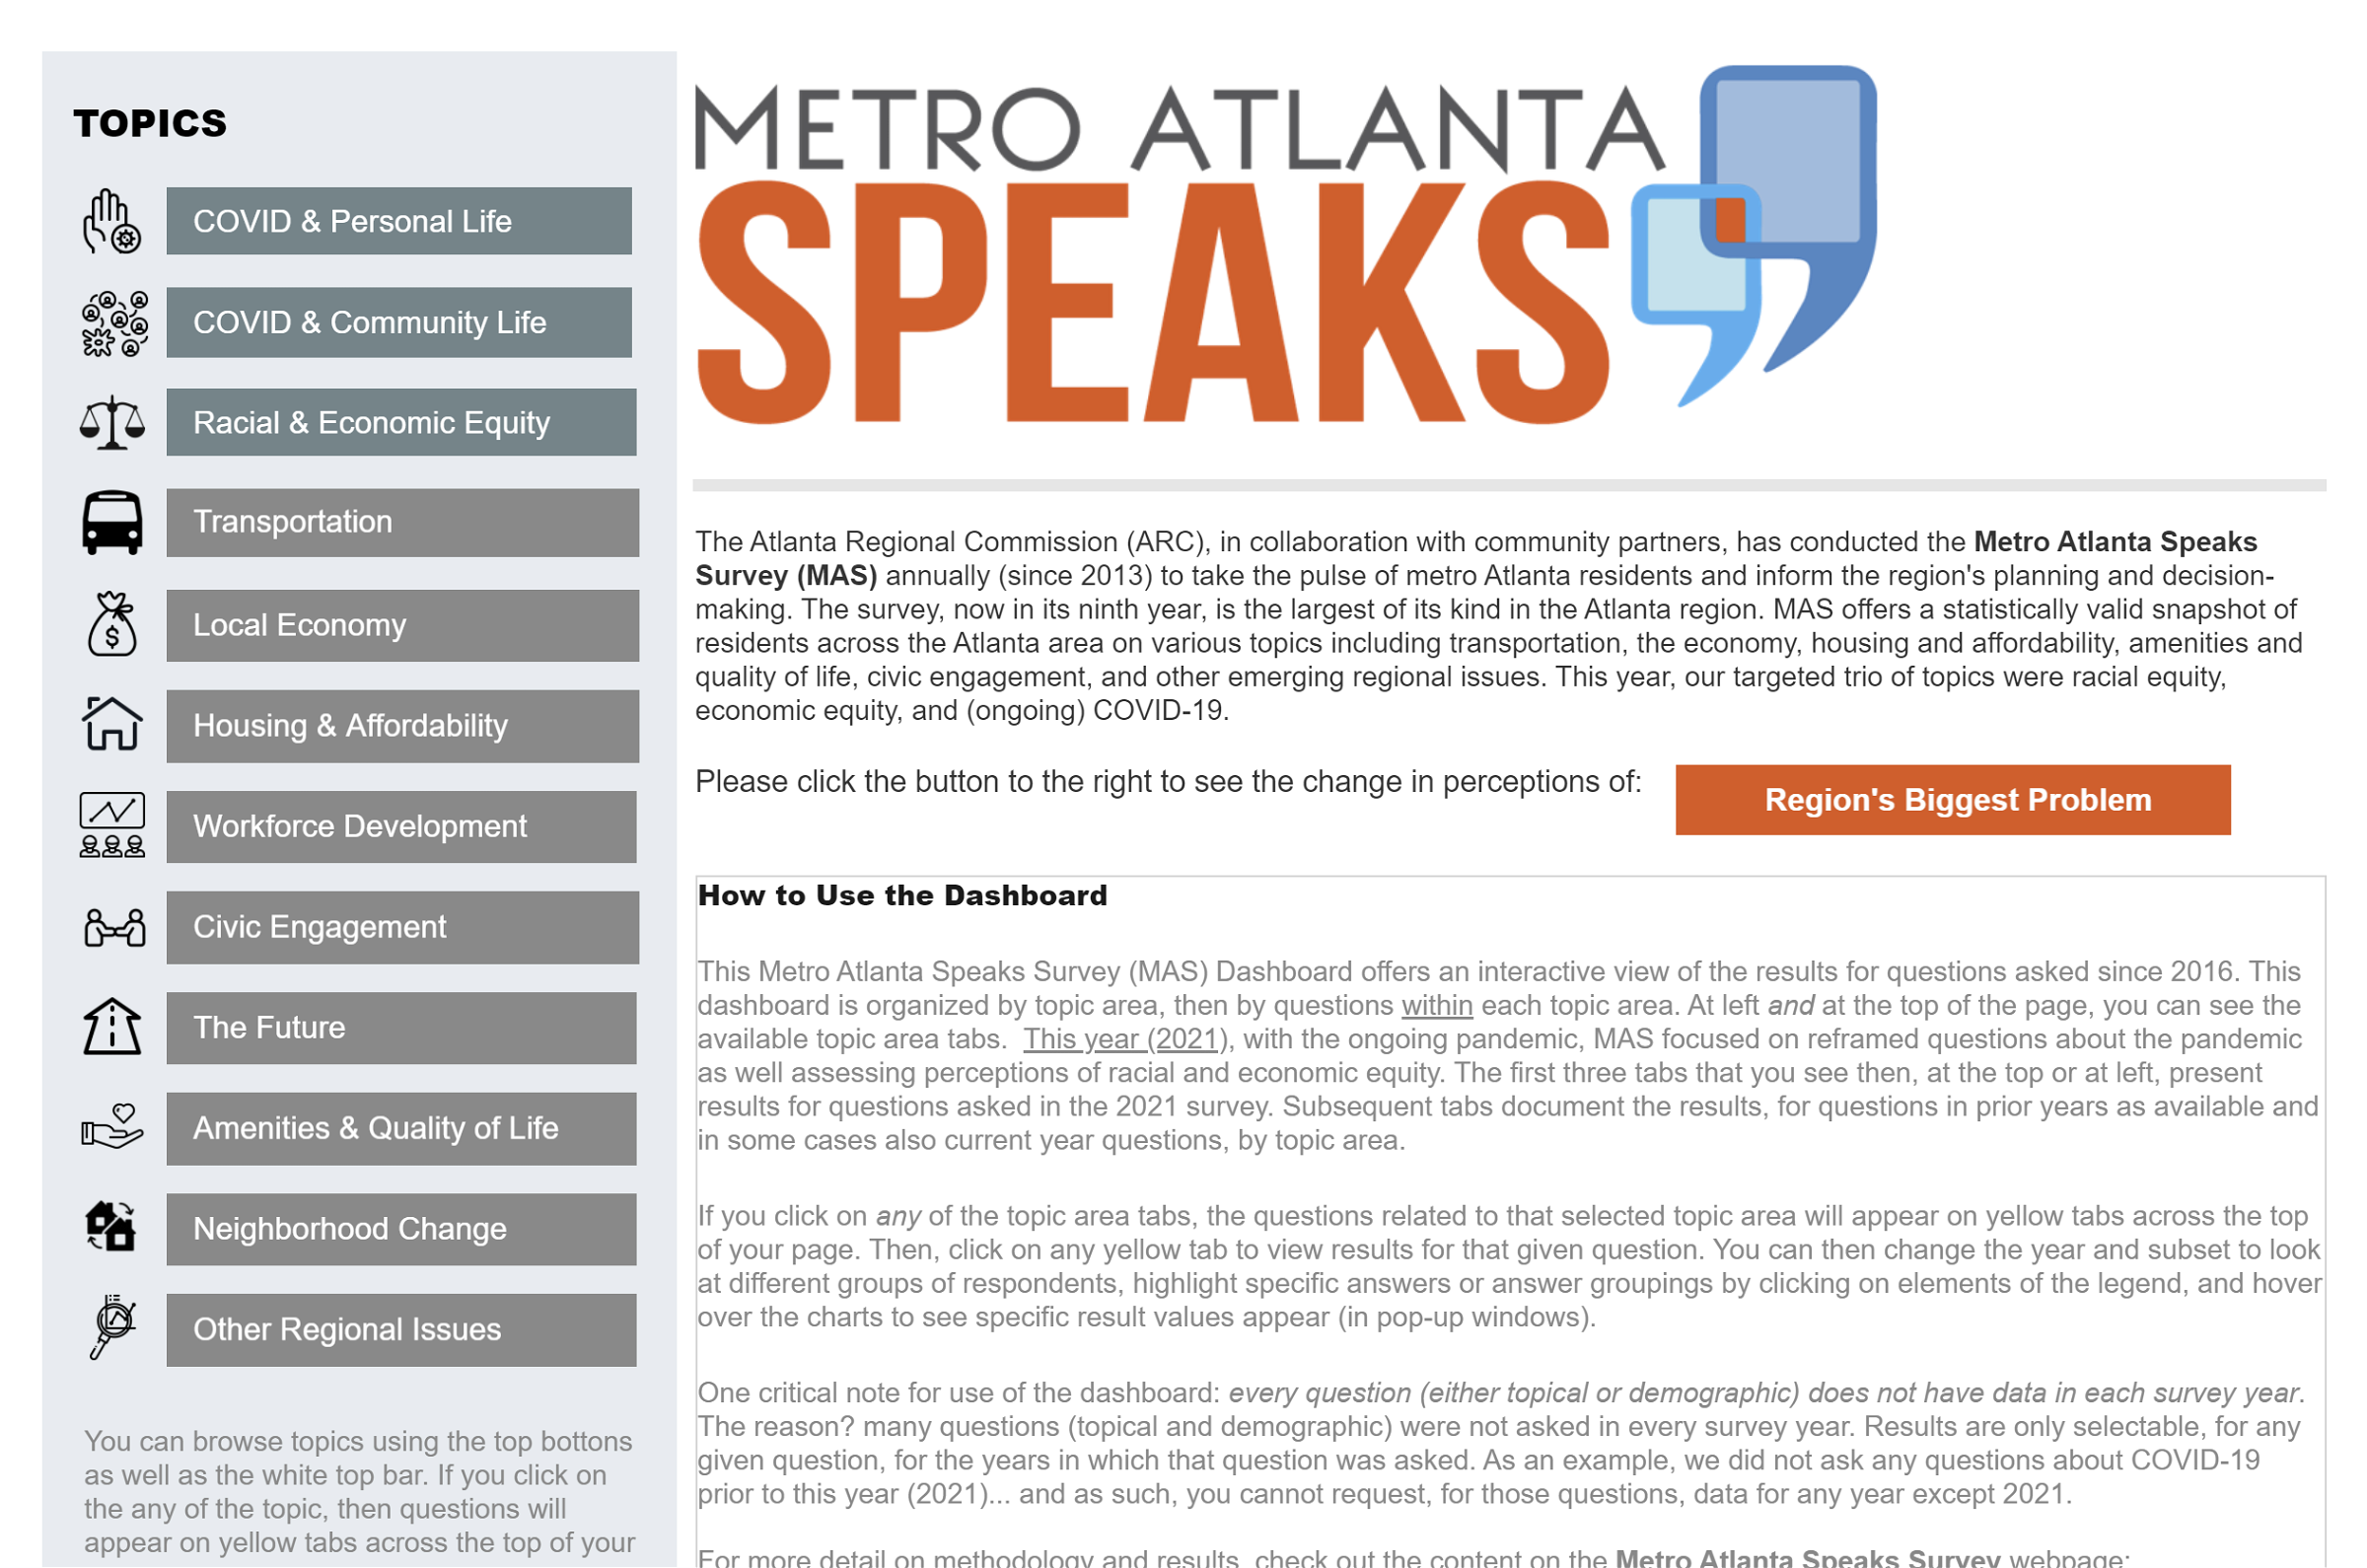
Results for the 2021 Metro Atlanta Speaks survey were released yesterday as part of the State of the Region Breakfast. This post compiles all the places you can go to learn more about the attitudes and perceptions about life in the 11-county area, from high-level overviews to data exploration dashboards.
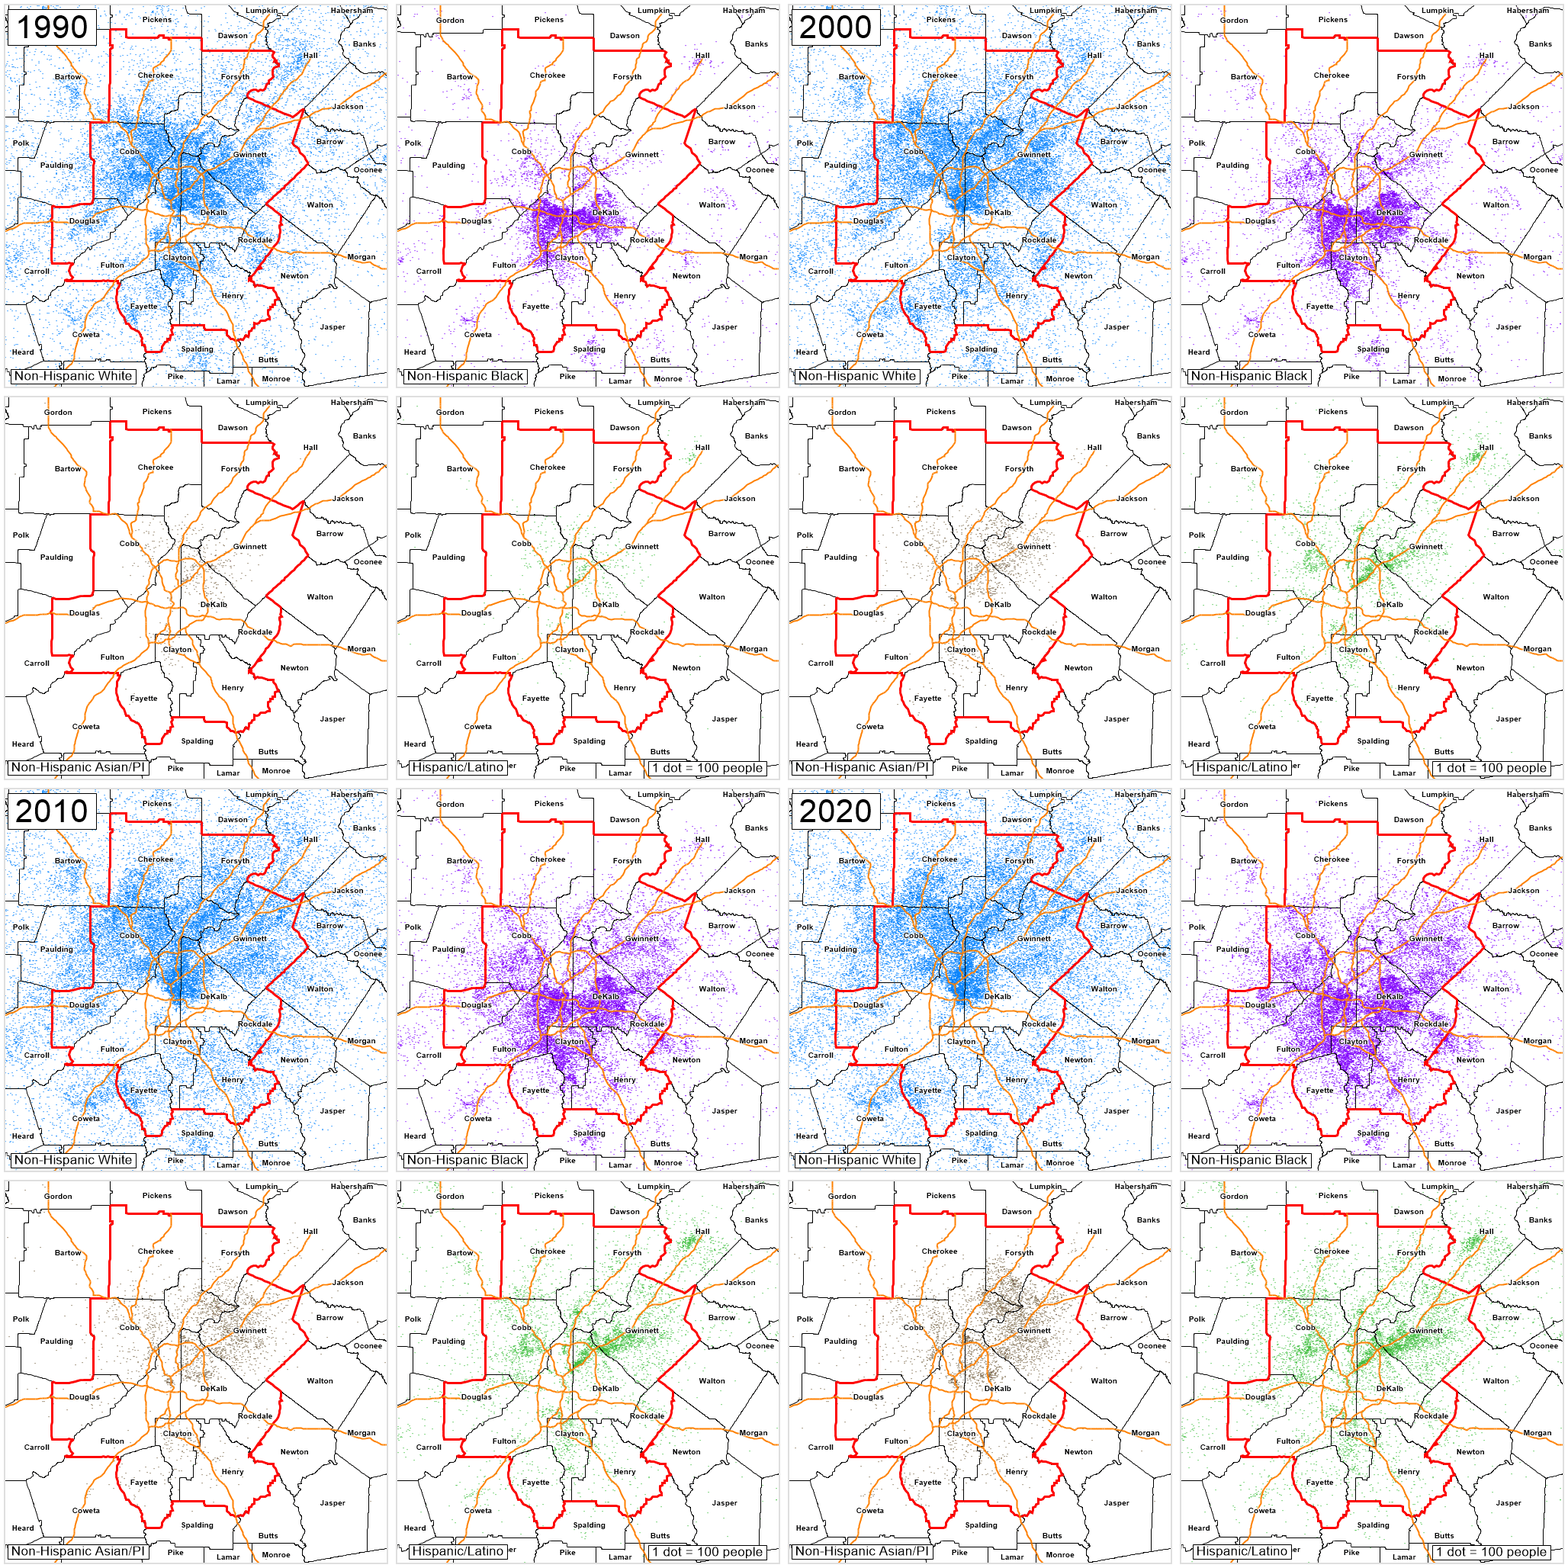
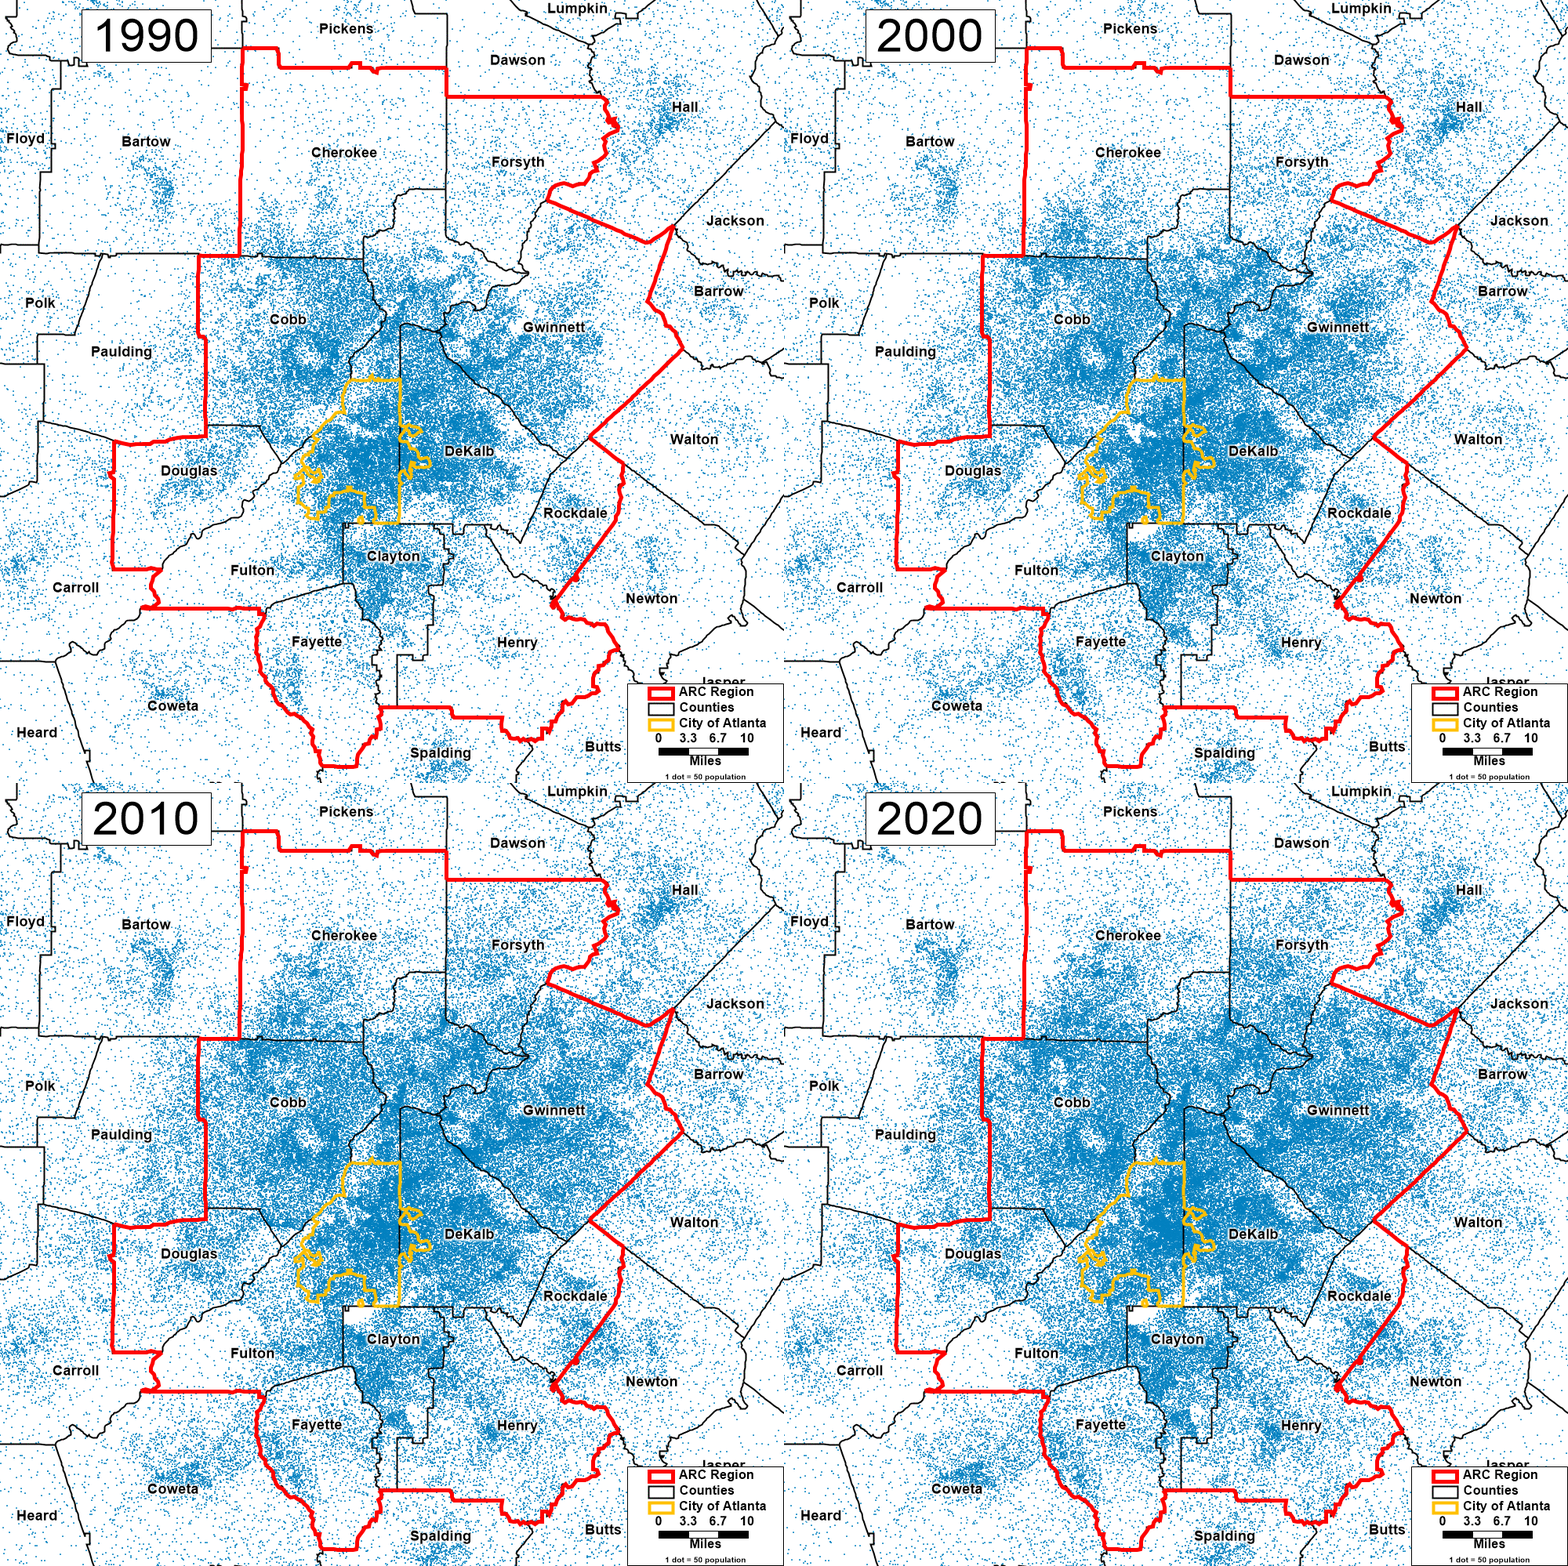
An animated map showing how our diverse population has grown and moved over time.
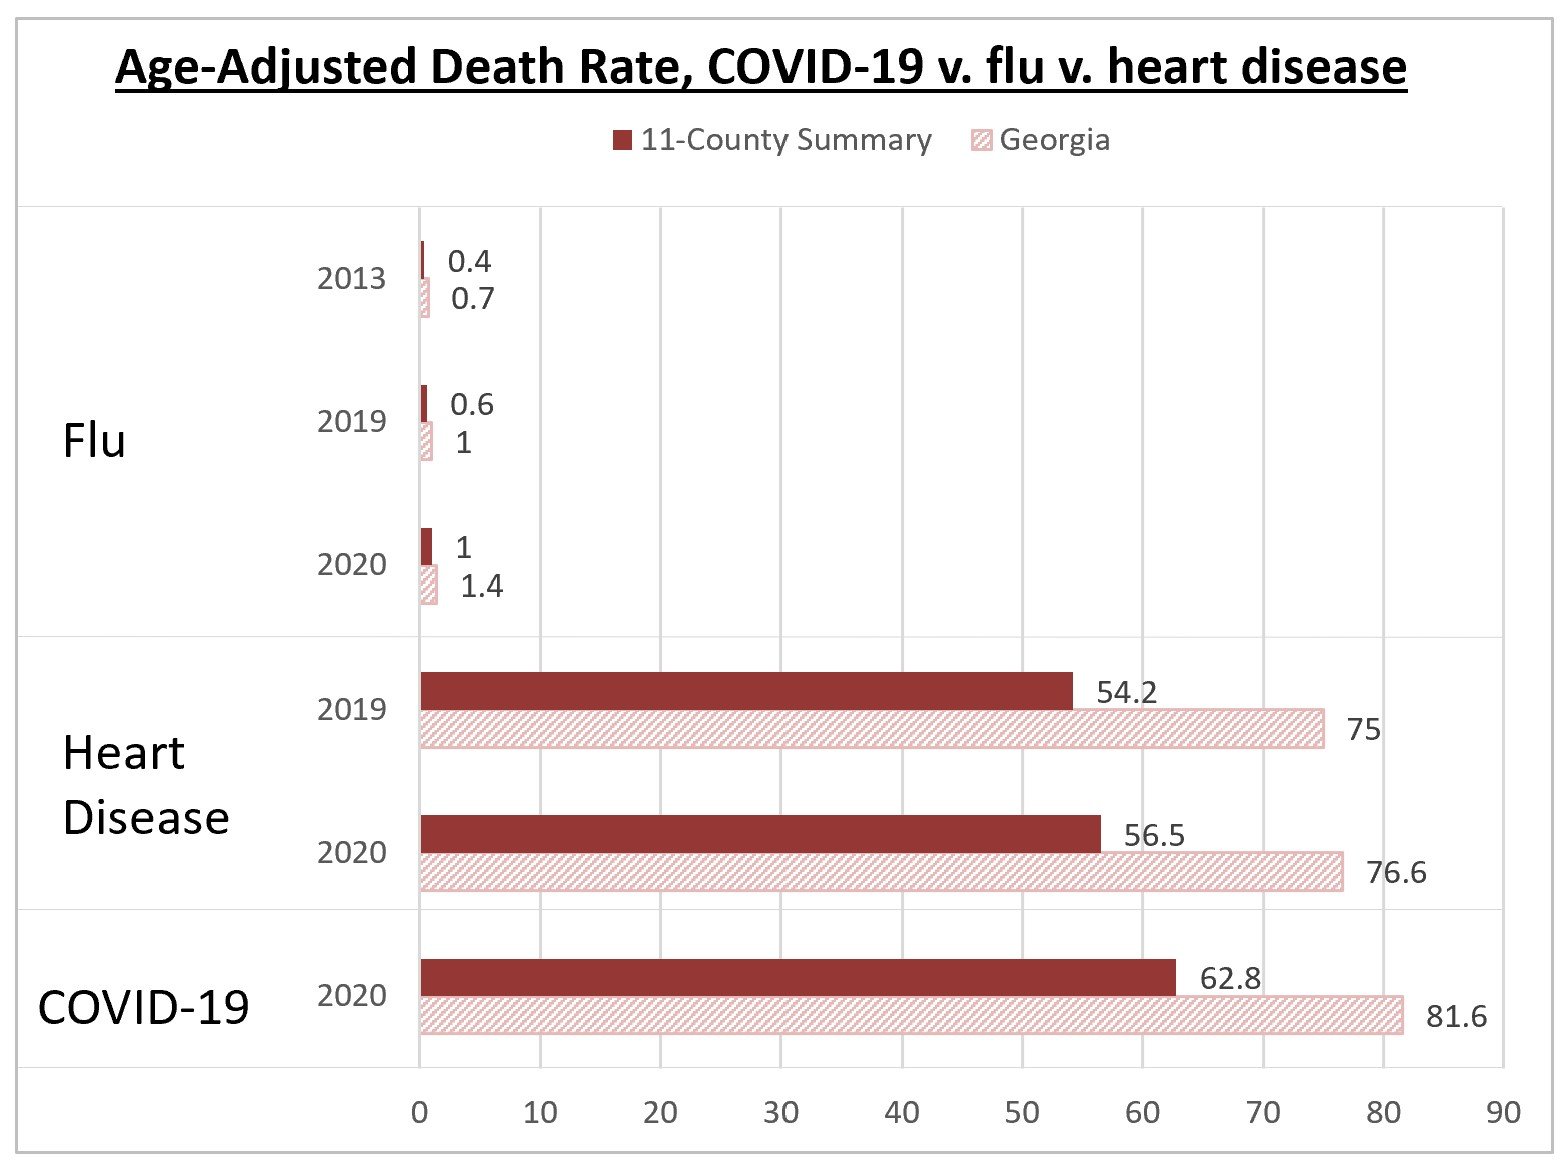
A high-level overview of the public health issues facing Metro Atlanta, including COVID-19, homicide, opioids and infant mortality.
New (2019) data on work locations for residents (by area) show that, for the most part, we are leaving our home county more to go to work than we were in 2010.
Hispanic homeownership grew from 2010 to 2019 across the Atlanta area, while the overall owner share was falling (and declining for both White and Black populations).
An animation showing population growth at the Census tract level over the past 30 years illustrates where and how we've grown since 1990.
Native American heritage month has arrived. This set of static maps shows territories in Georgia and throughout North America.