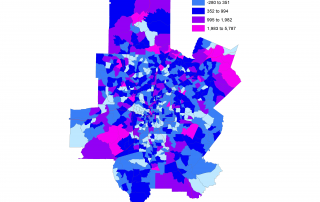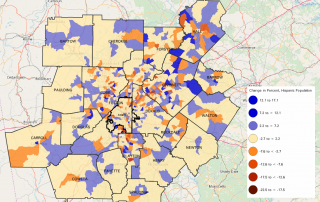
Monday Mapday: Growth in Hispanic Population: 20-County Metro Region
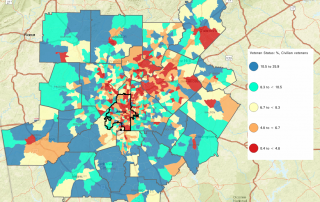
The recent release of 2012-16 American Community Survey (ACS) data gives us an updated ability to look at small-area changes in race/ ethnicity across the metro region. The map below shows the change in share (in percentage points) of Hispanic and/or Latino population by census tract between 2010 and the 5-year period ending in 2016. [...]