
Data Diversions
Data, articles and information that have us putting our to-do lists on hold (formerly Web Wednesday).

Atlanta’s Violent Crime: One Big Decline, Many Little Stories
Atlanta's violent crime rate is near its historic low. A deeper dive by type and location reveals additional stories.
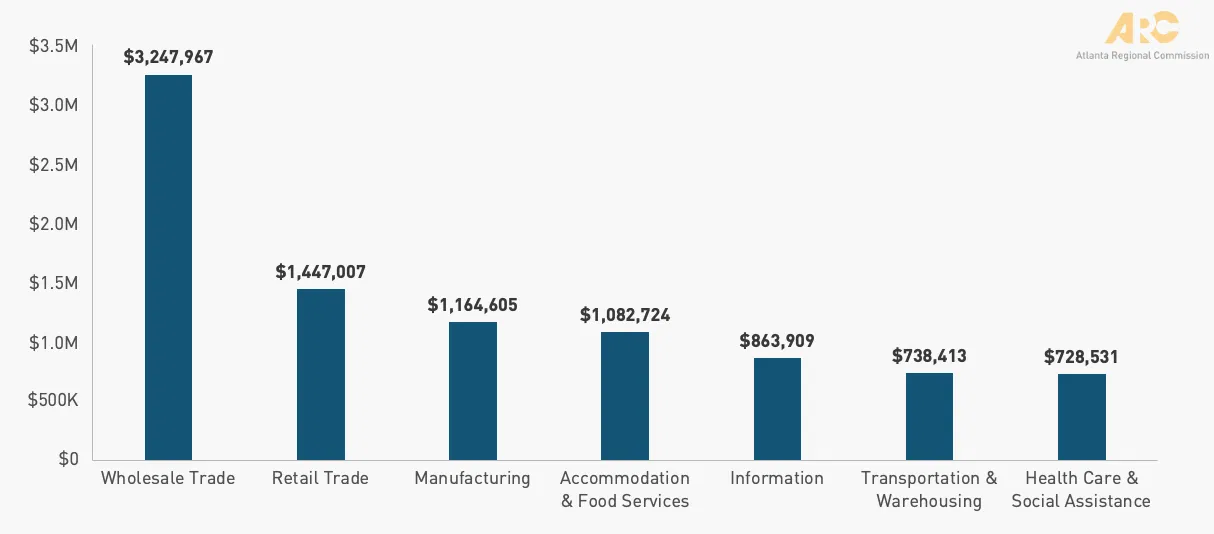
The State of Black-Owned Businesses in Metro Atlanta (pt. 2)
Following up from an earlier post, we look at a few characteristics of Black-owned employer businesses in metro Atlanta.
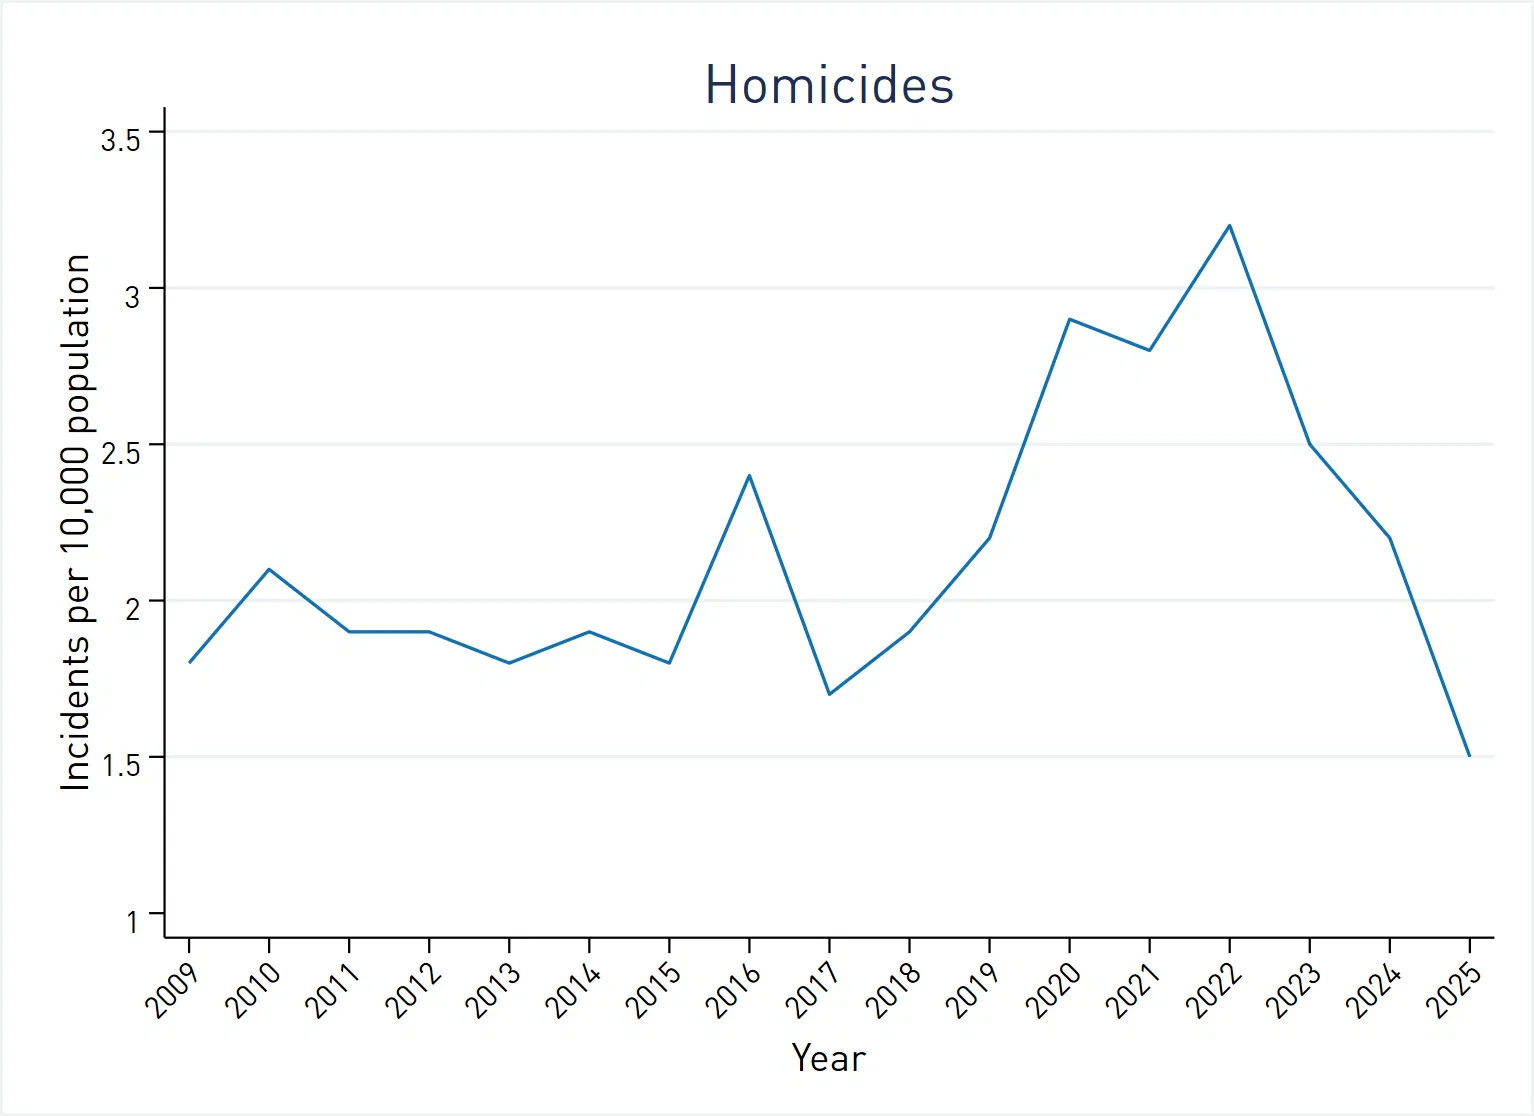
Atlanta’s Historic Homicide Hush
The homicide rate for the City of Atlanta hit a historic low in 2025. How does that vary across the city, and is neighborhood revitalization responsible?

Go For (Population) Gold!
We pitted metro Atlanta against seven peer metros in an animated population race spanning 1980 to 2024. Grab your popcorn and see who takes home the gold!

The State of Black-Owned Businesses in Metro Atlanta
Today's post looks at the latest data from the Census Annual Business Survey, comparing Metro Atlanta to the national baseline and other Sunbelt cities regarding Black-owned employer businesses.

Honoring Service: A Data Look at Atlanta’s Veterans
In honor of Veteran's Day: dive into the data to see who served, when they served, and where Atlanta ranks nationwide.