
In a previous post, we saw how the homicide rate in Atlanta dropped to a historic low in 2025. How does that compare to the trend for other types of violent crime, and what sort of variation do we observe among Atlanta’s Neighborhood Planning Units (NPUs)?
Once again, we rely on data from the Atlanta Police Department’s (APD) Open Data Portal. Figure 1 shows the violent crime rates for the City of Atlanta from 2009 through 2025.
Figure 1: Violent Crime Rate for the City of Atlanta, 2009-2025
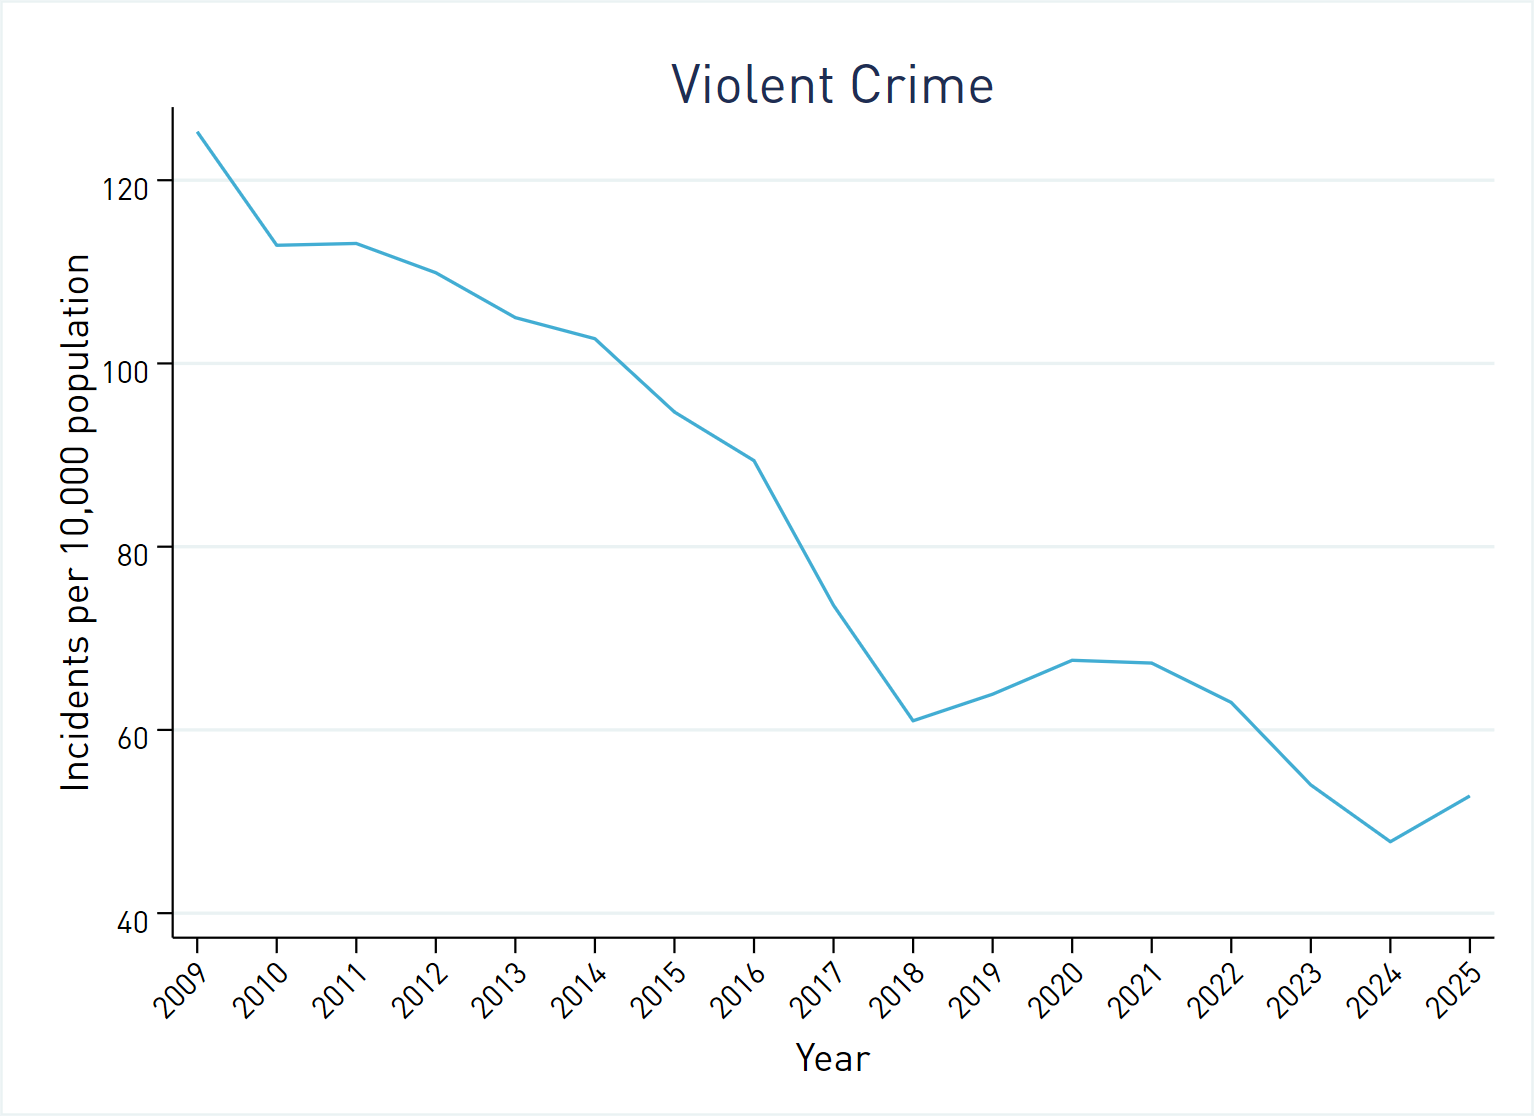
Data Source: Atlanta Police Department Open Data Portal
As this graph shows, violent crime declined steadily from 2009 through 2018; it rebounded somewhat in 2019, 2020, and 2021; and then hit a historic low in 2024. In 2025, the violent crime rate ticked up slightly, but remained below the 2023 level. This represents a 58% decline since 2009.
Figure 2 breaks violent crime down into its three types: aggravated assault, robbery, and homicide.
Figure 2: Violent Crime Rate by Type for the City of Atlanta, 2009-2025

Data Source: Atlanta Police Department Open Data Portal
This graph shows that these categories follow different trajectories. From 2009 through 2015, aggravated assault and robbery occurred at roughly comparable rates. Though both have been on a general decline over the period covered by our data, robbery showed a much greater decline starting 2015. And while aggravated assault saw a bump during COVID-19, robbery continued to decline steadily. Homicide, the most serious type of violent crime, is also the rarest. We include it here for comparison, but its scale makes it difficult to visualize alongside the other categories, which is why we dedicated a separate post to it.
How have violent crime rates changed by NPU? The previous post dug into changes in homicide rates, so we’ll focus on robbery and aggravated assault.
Figure 3 displays robbery and aggravated assault rates over time by NPU.
Figure 3: Aggravated Assault and Robbery Rates for Atlanta Neighborhood Planning Units, 2009-2025
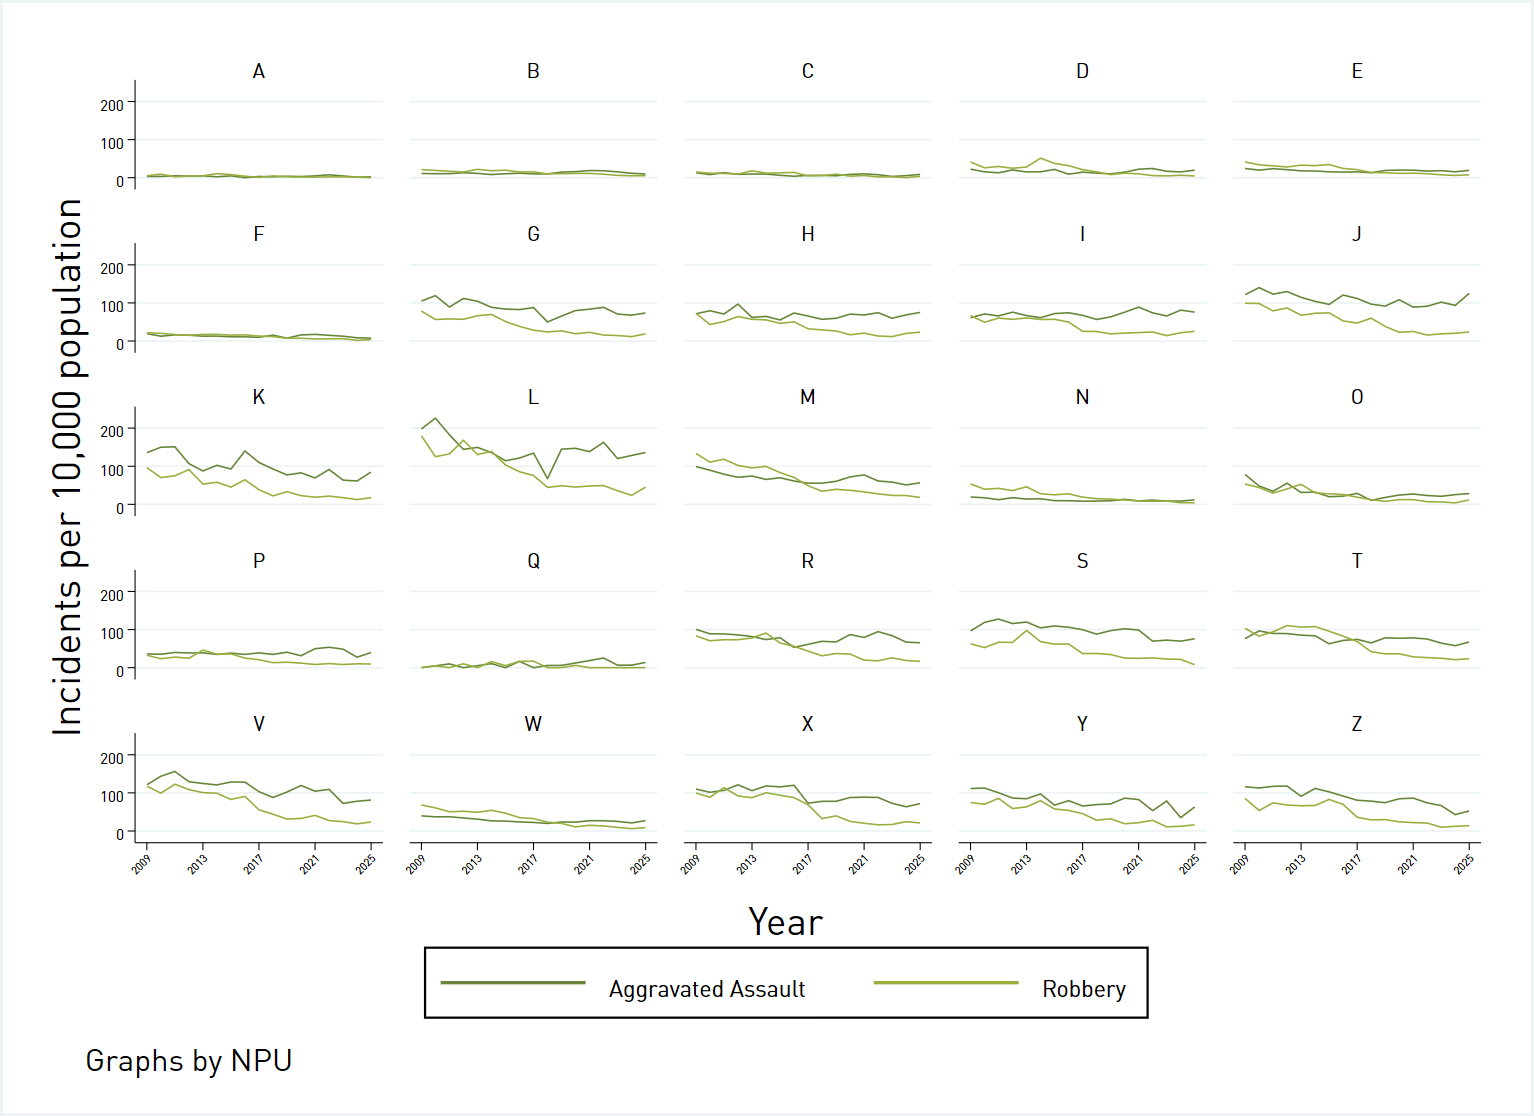
Data Source: Atlanta Police Department Open Data Portal
As we saw with homicides in the previous post, some parts of the city– primarily on the northside– such as NPUs A, B, C, and F have had very low rates of both types of violent crime throughout the seventeen years covered by our data. But even these areas showed some improvement over time. The most notable improvements in robbery rates, measured by the slope of the trend line, belong to NPUs L, M, V, X, and T. In terms of aggravated assault rates, NPUs K, Z, V, L, and Y exhibited the greatest improvements.
In conclusion, despite a slight uptick in violent crime in 2025 driven mostly by a rise in aggravated assaults, violent crime is near its historic low across the city. In the next post, we will take a look at property crime in 2025: burglary, larceny, and auto theft.