
With February being Black History Month, we are revisiting our analysis from last year of the region’s Black-owned employer business landscape. New annual data from the Census Annual Business Survey (ABS) allows us to further this analysis to consider trends over time from 2017 to 2023. While the “boom” we previously highlighted remains a defining feature of our regional economy, the latest figures provide a nuanced view of how the Atlanta Metropolitan Statistical Area (MSA) compares to both the nation and a few Sunbelt peers.
Chart 1: Black-Owned Businesses as a Percent of All Businesses Over Time
Metro Atlanta continues to stand out as a hub for Black entrepreneurship. According to the most recent data, 10.7% of all employer businesses in the Atlanta MSA are Black-owned. While this represents a slight dip from the 11.3% reported in the previous year’s release, the region’s share remains remarkably robust:
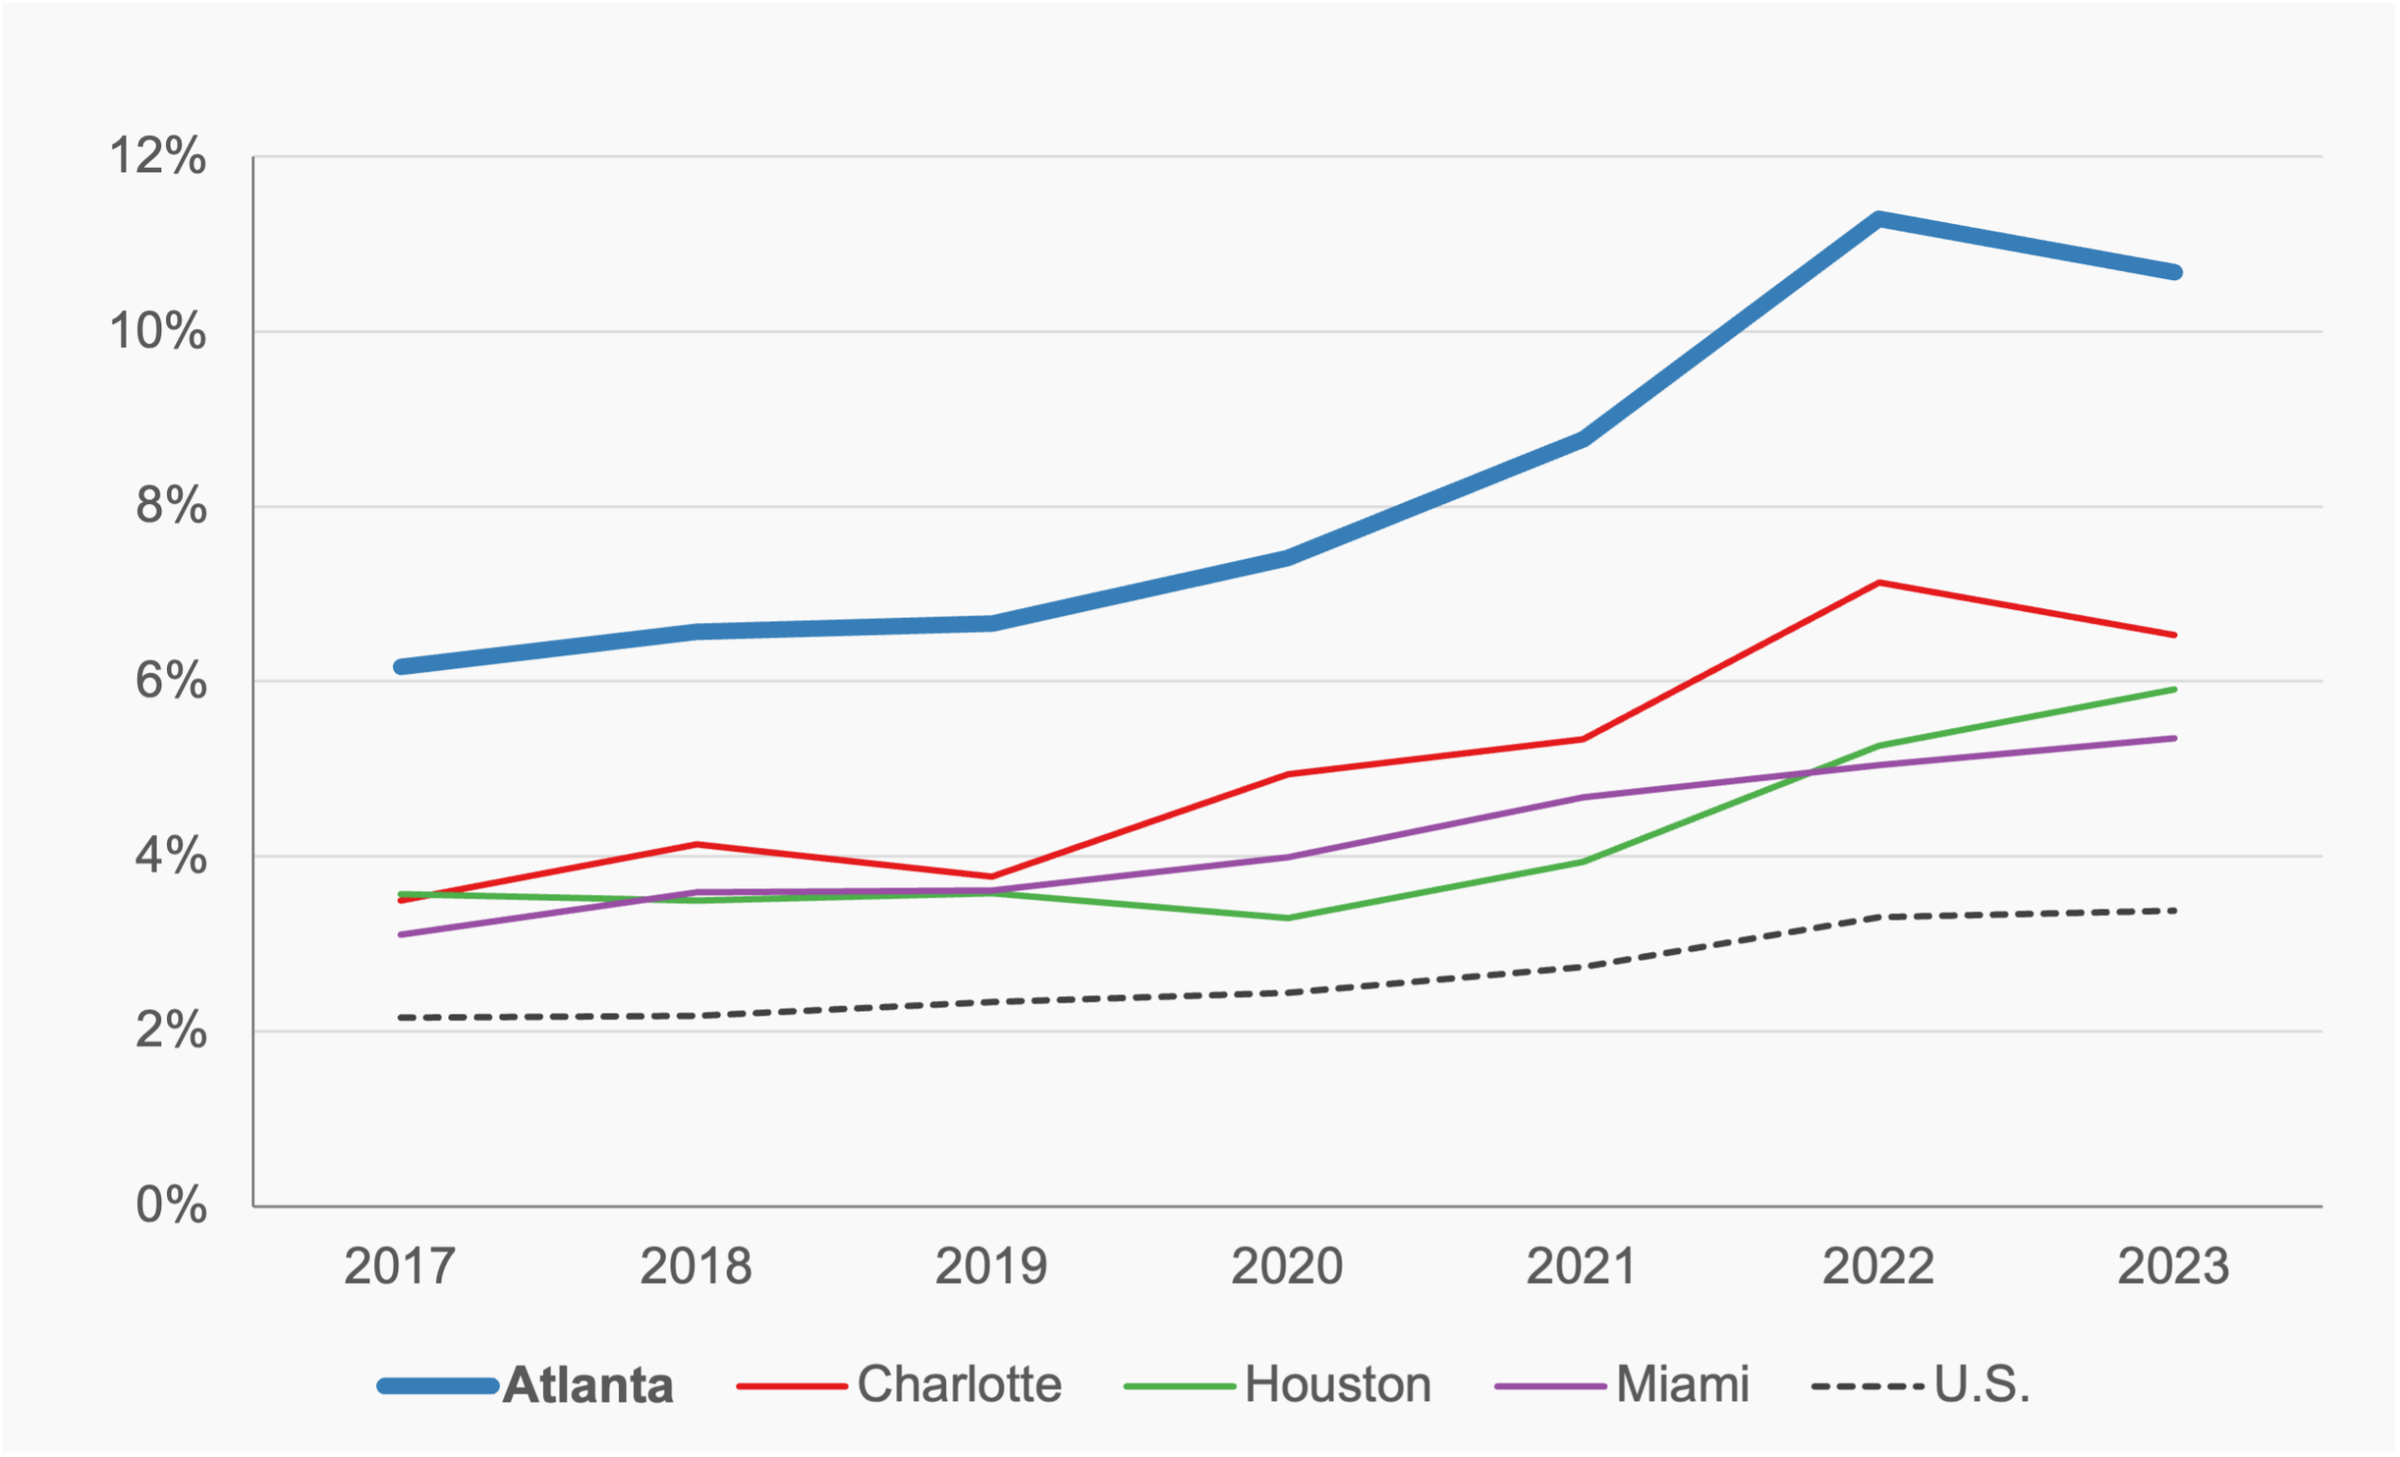
As shown, Atlanta’s 10.7% share significantly outpaces the national average of roughly 3% and leads fellow Sunbelt metros like Charlotte, Houston, and Miami, all of which hover between 5% and 7%. However, a closer look at the demographics reveals a persistent gap in representation:
- Atlanta MSA: 10.7% of employer businesses are Black-owned, while the Black population (per the 2023 ACS 5-Year estimate) represents roughly 34% of the total population.
- Charlotte MSA: 6.5% of businesses are Black-owned vs. 22.2% of the population.
- Houston MSA: 5.9% of businesses are Black-owned vs. 17.3% of the population.
- Miami MSA: 5.4% of businesses are Black-owned vs. 20.3% of the population.
- U.S.: 3.4% of businesses are Black-owned vs. 12.4% of the population.
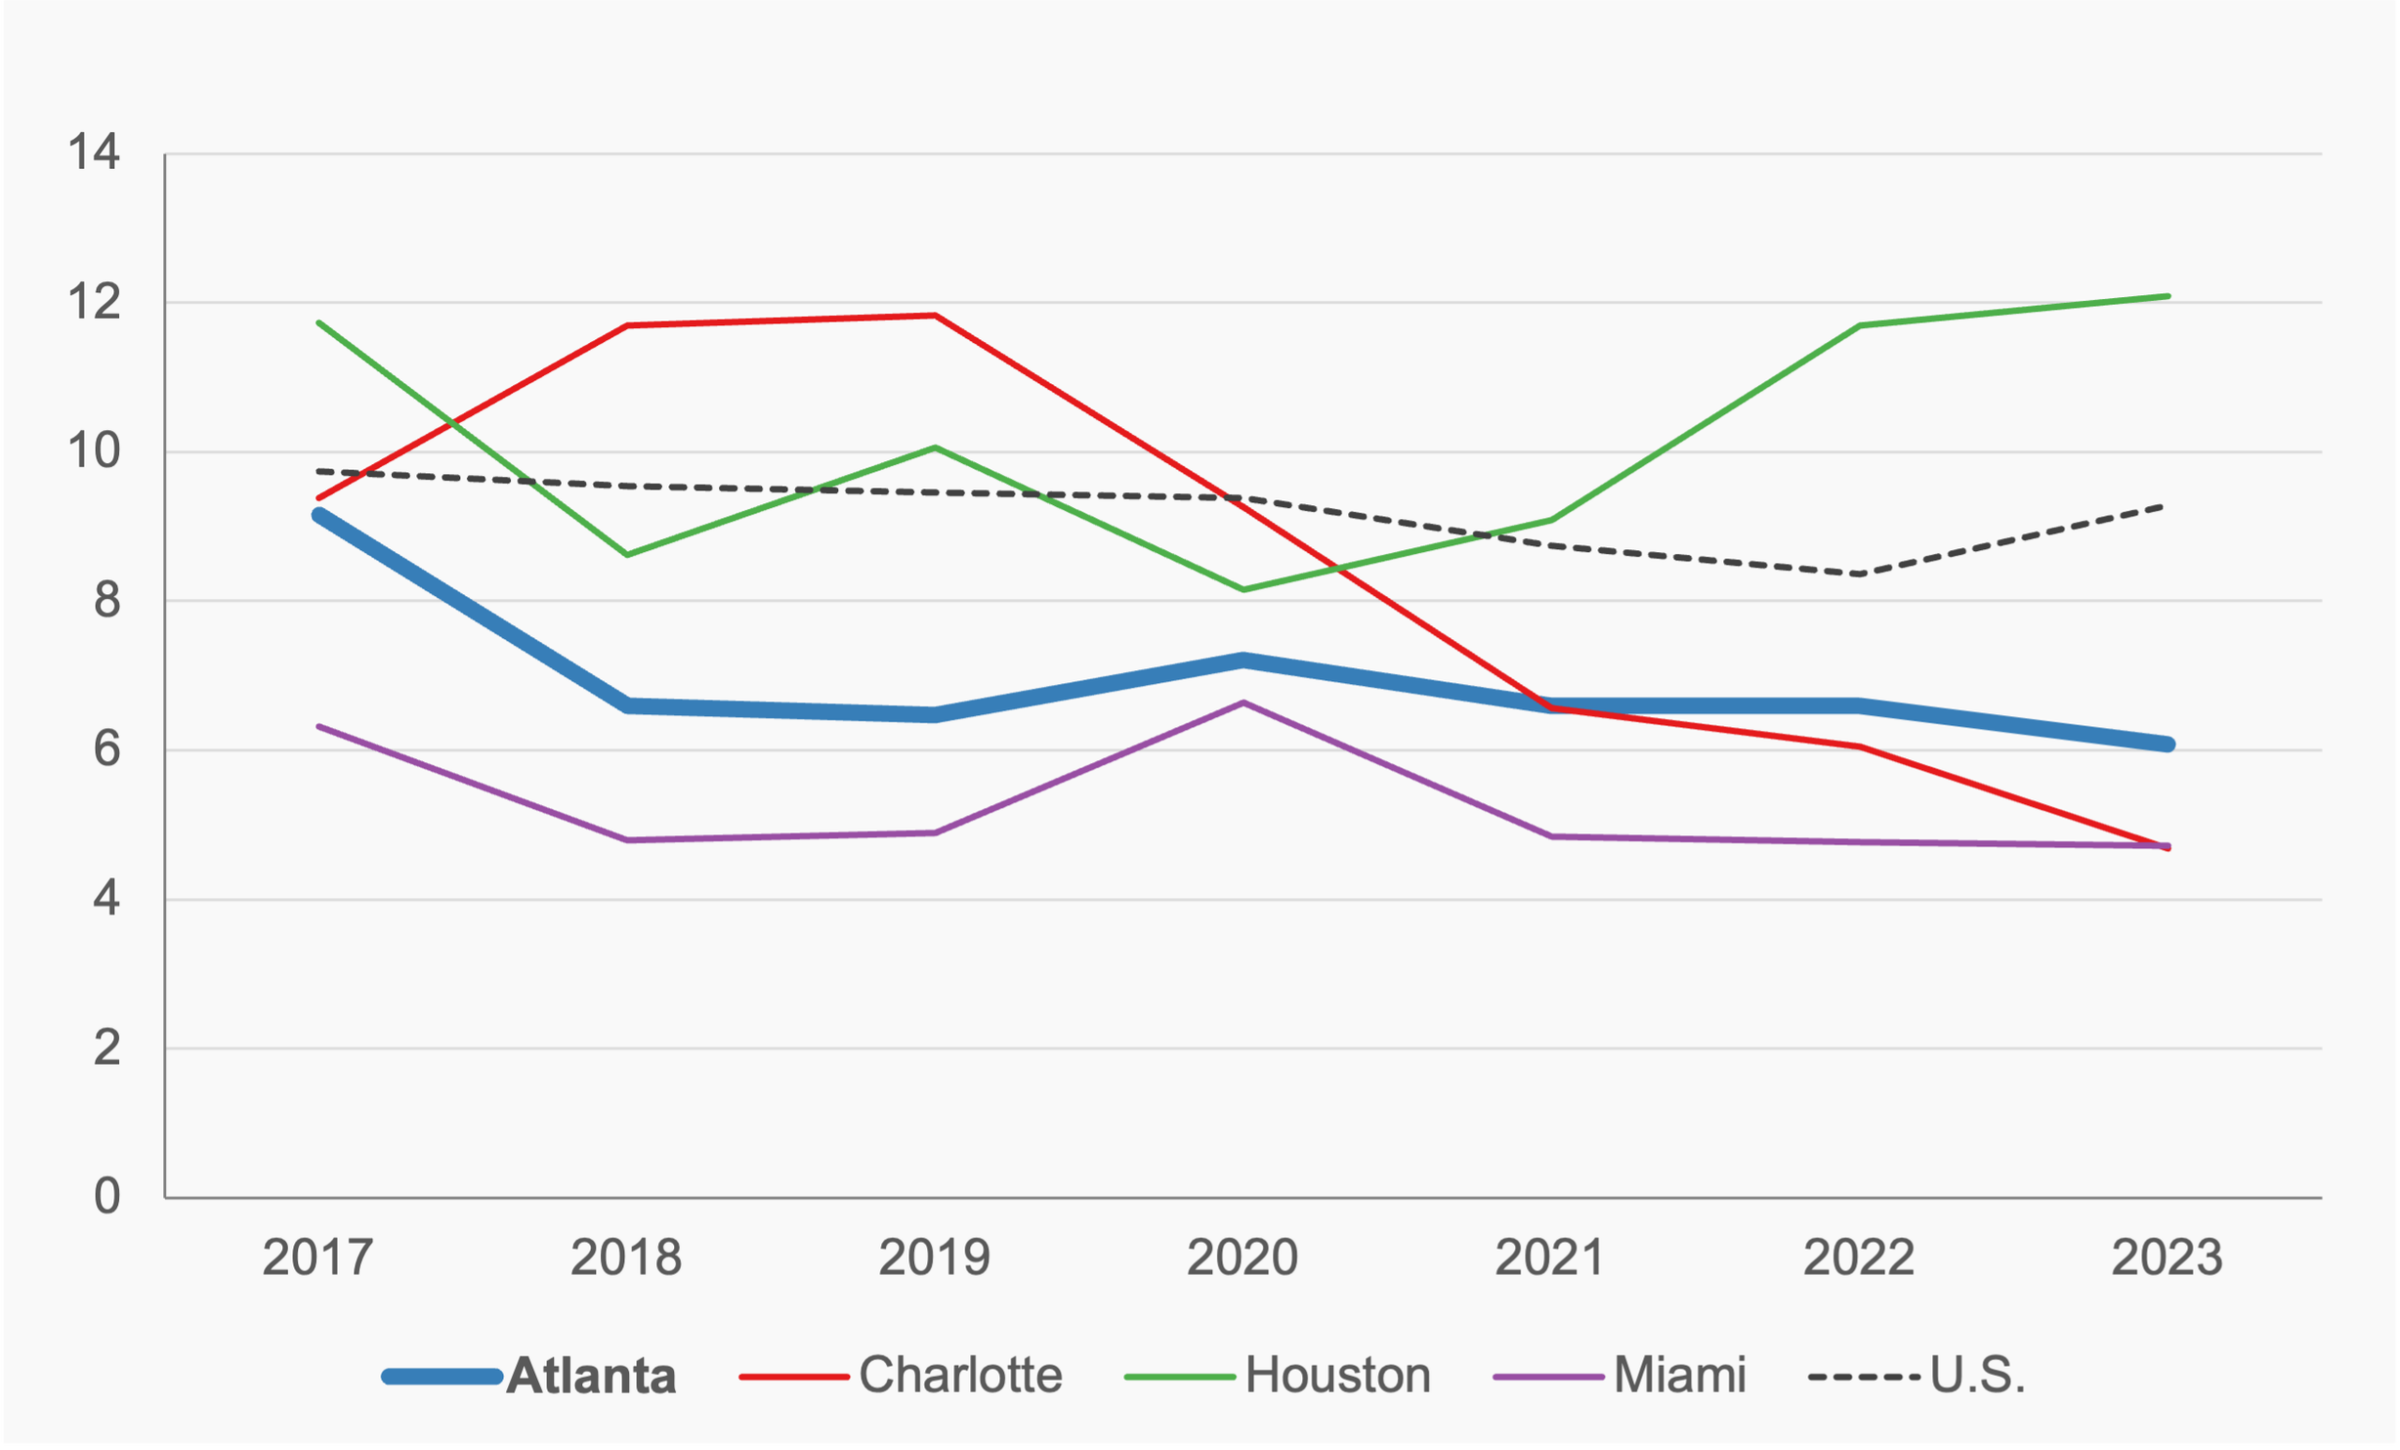
Related to this, we have charted Black-owned employer businesses per 1,000 Black residents for these metro areas and nationally, shown here:
Chart 2: Black-Owned Businesses Per 1,000 Black Residents

Atlanta also features 6.2 Black-owned employer businesses per 1,000 total residents (of all races), which ranks ahead of the national average as well as Charlotte and Houston from the above peer metros.
When we look beyond the number of firms to the size and economic impact of these businesses, the data show a stable environment for growth. In 2023, metro Atlanta’s Black-owned employer businesses employed an average of just over 6 employees per firm, a number that has been trending down in recent years. While the metro’s average remains below the national average, this number remains above cities like Charlotte and Miami:
Chart 3: Average Employment in Black-Owned Businesses Over Time
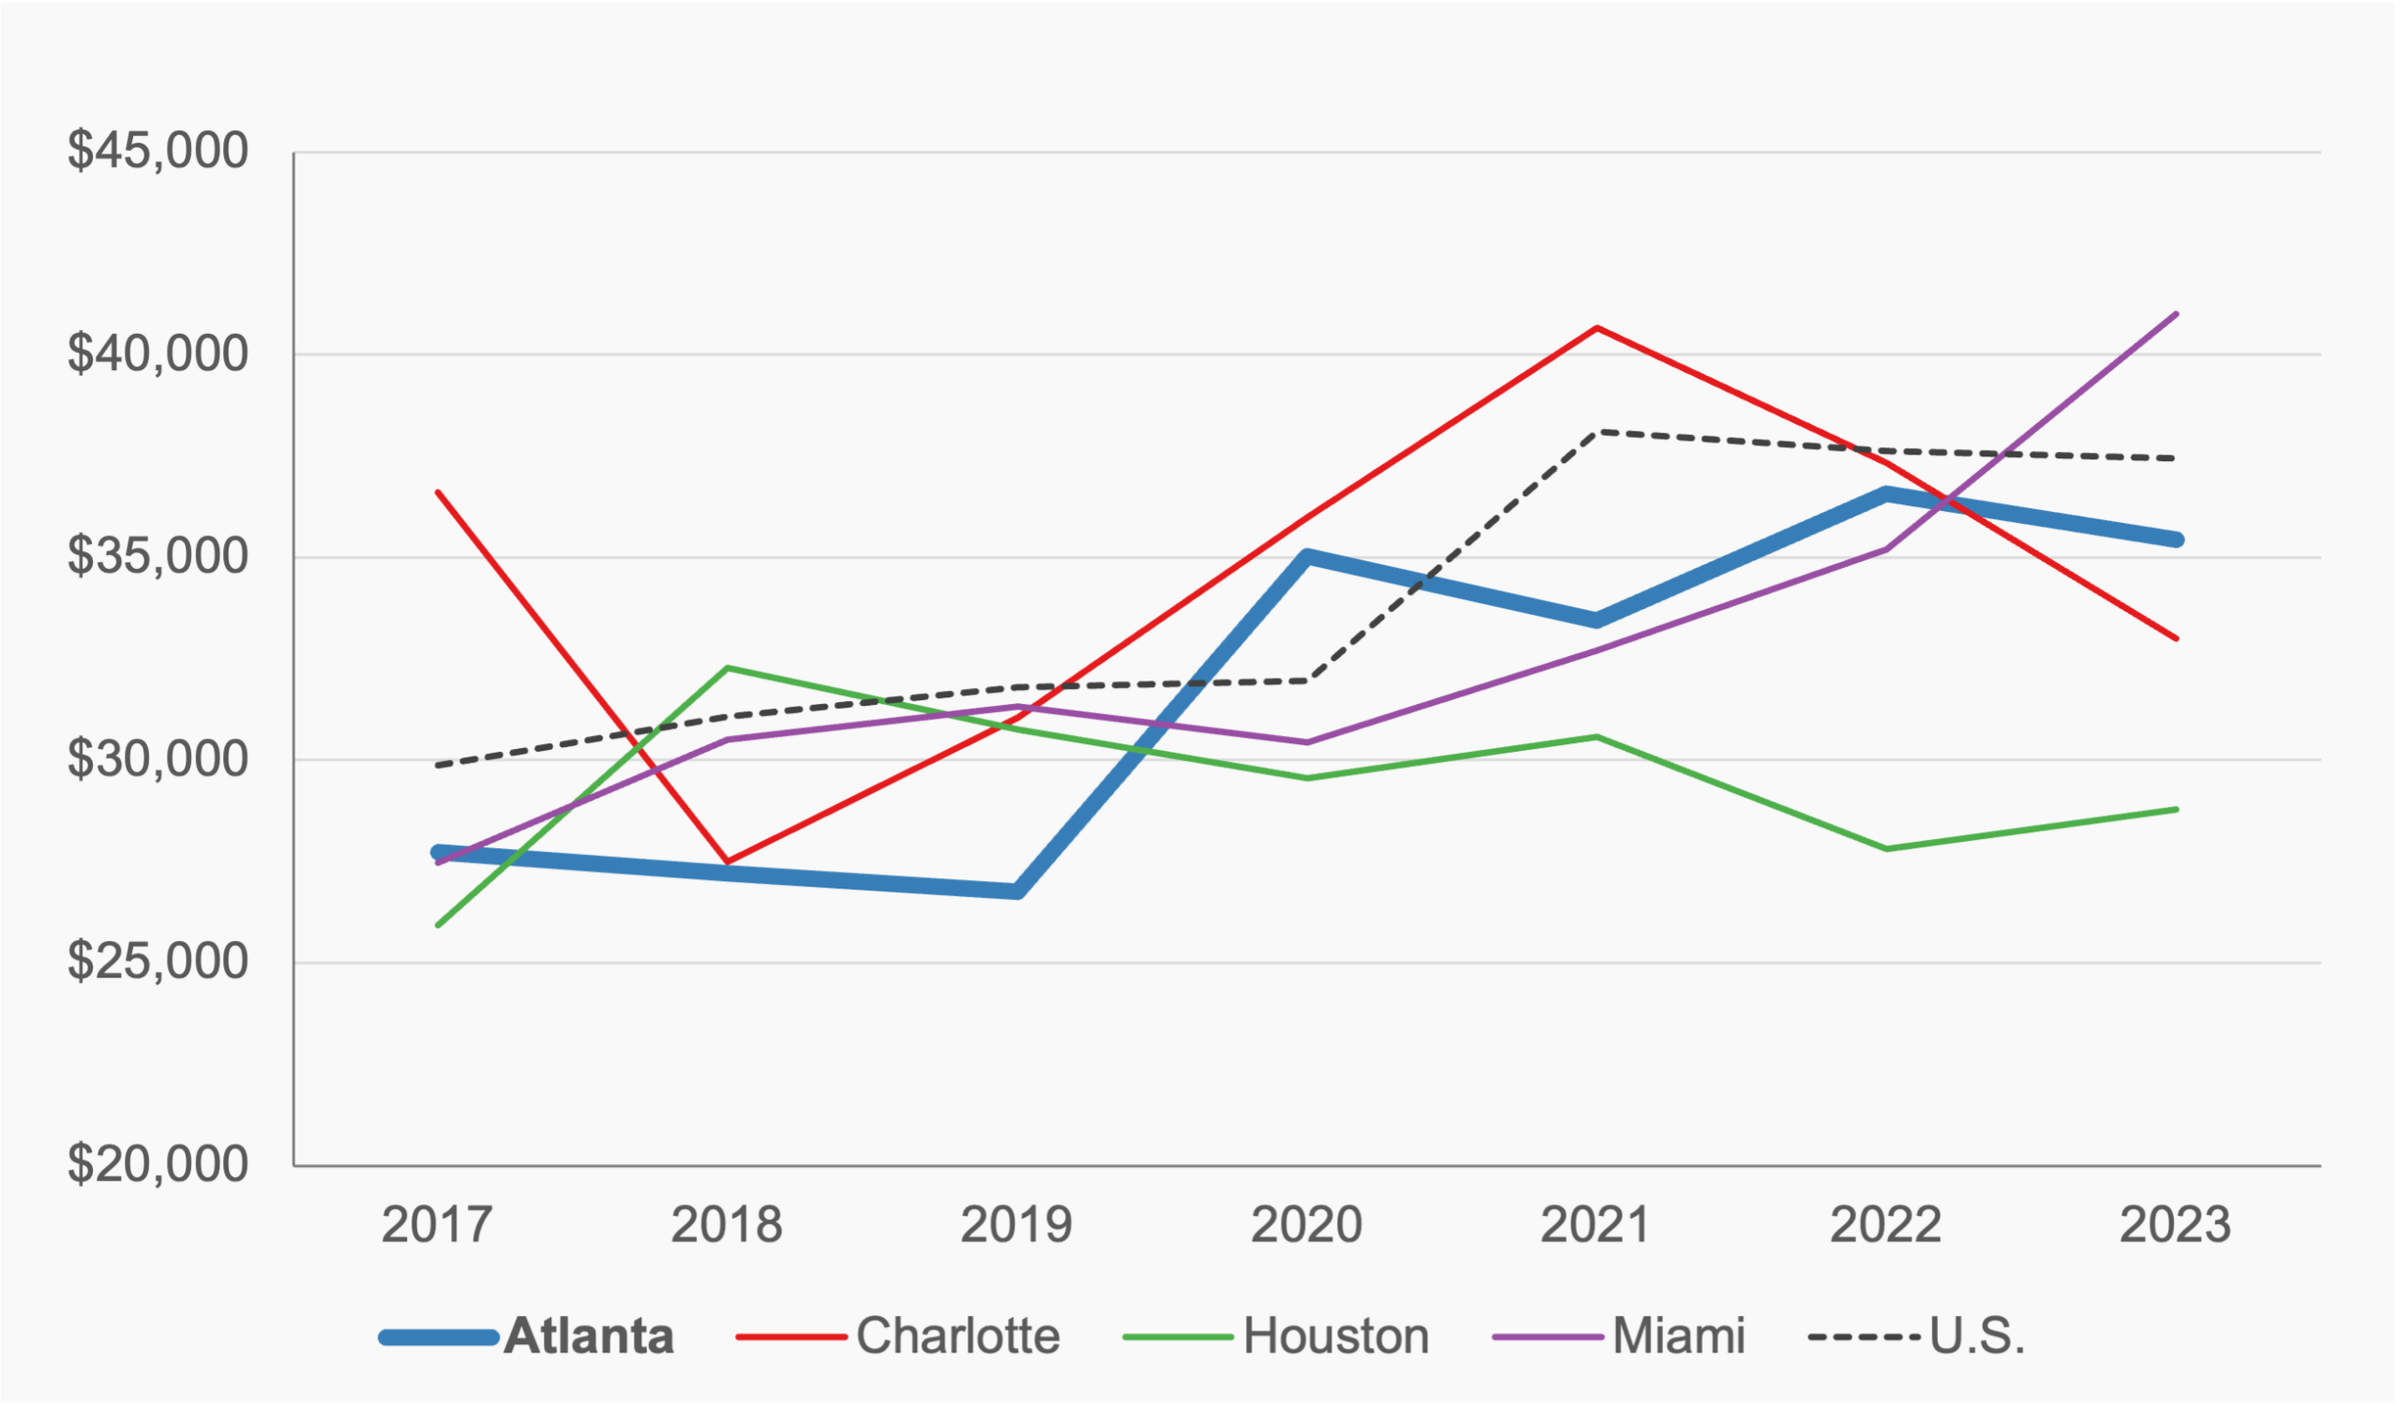
Atlanta sits in the middle of the pack among its peers when considering average annual payroll of Black-owned employer businesses. The average annual payroll in metro Atlanta in 2023 was approximately $35,500, down slightly from 2022 (roughly $36,500). Despite the recent drop, metro Atlanta’s average annual payroll in Black-owned employer businesses has been steadily rising since 2017 and remain just below the national average of approximately $37,500:
Chart 4: Average Annual Payroll in Black-Owned Businesses Over Time
The continued growth and prominence of Black-owned employer firms in the region are a testament to metro Atlanta’s status as a center for innovation and entrepreneurship. These data from the ABS help give shape to the state of Black-owned employer businesses in our metro area and where business assistance may be most effective.