In two recent posts, we investigated trends in homicide rates as well as those for robbery and aggravated assault in the City of Atlanta, finding that all three types are at or near their historic lows. What did property crime look like in 2025? How does that compare historically? How does property crime vary by type and by part of the city?
We turn once more to data provided through the Atlanta Police Department’s (APD) Open Data Portal. Figure 1 shows the property crime rate for the City of Atlanta from 2009 through 2025.
Figure 1: Property Crime Rate in the City of Atlanta, 2009-2025
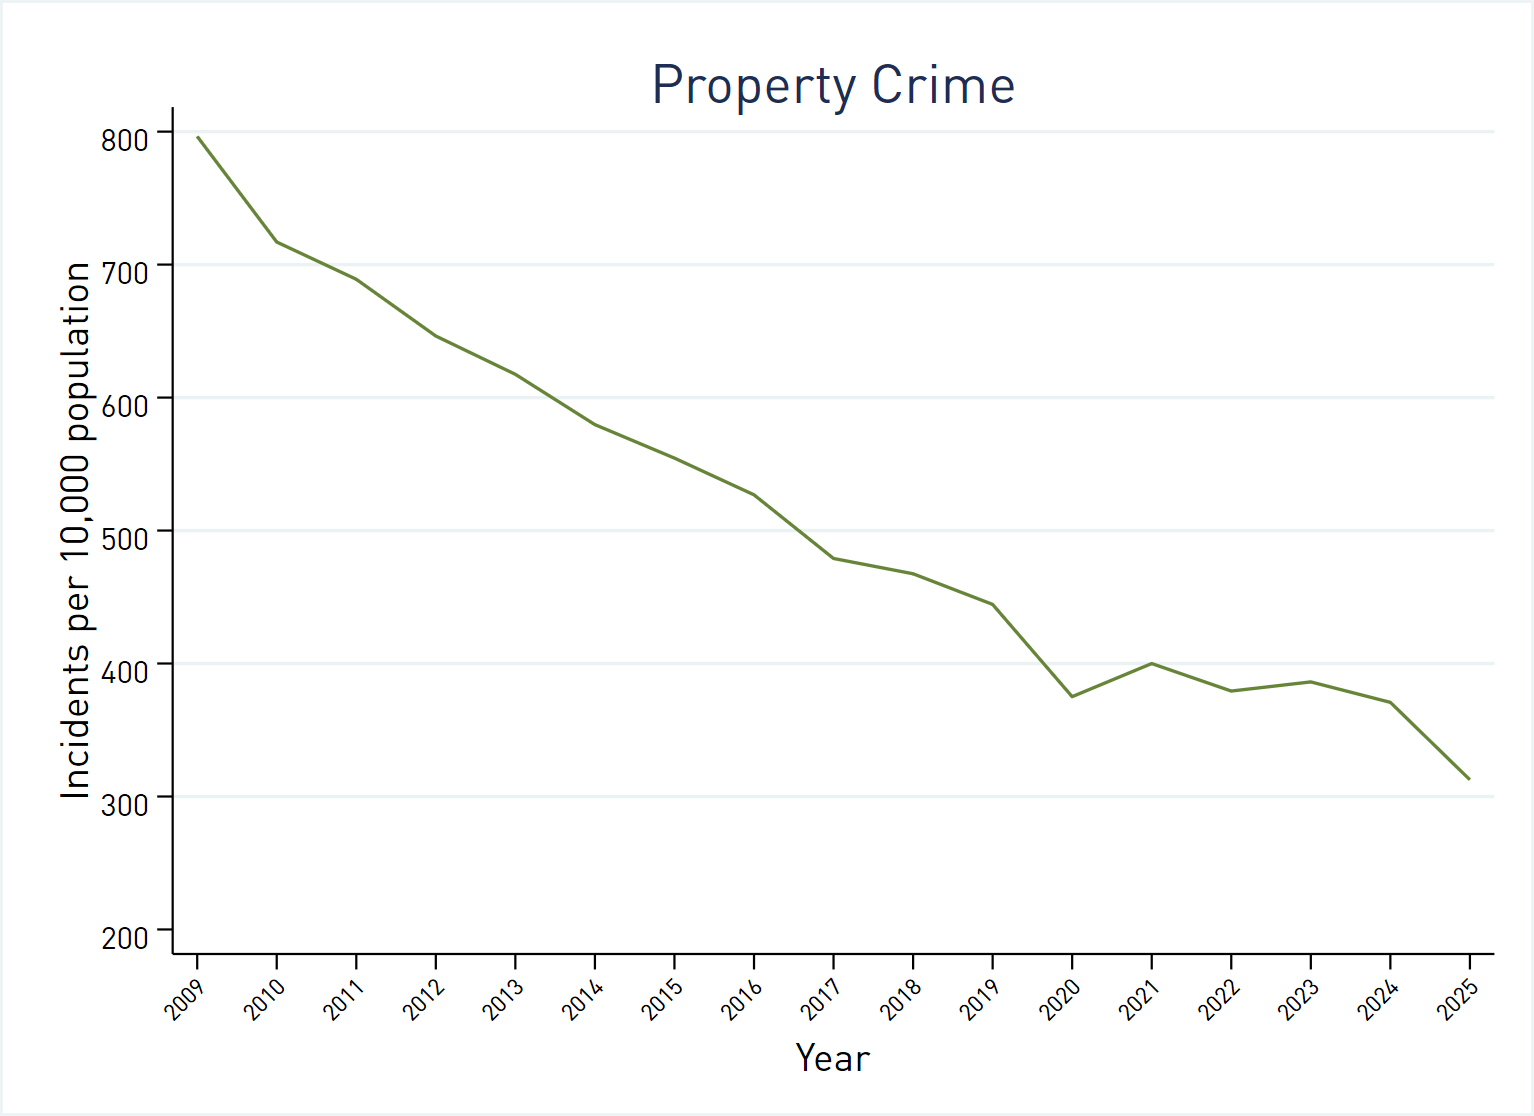
Data Source: Atlanta Police Department Open Data Portal
As this graph shows, property crime has been on a fairly steady decline throughout the seventeen-year-long period covered by our data. The rates stabilized temporarily in the early 2020s, but dipped in 2024 and again in 2025 to reach historic lows.
Figure 2 breaks property crime down into its three constituent categories: burglary, larceny, and auto theft.
Figure 2: Property Crime Rates by Type in the City of Atlanta, 2009-2025
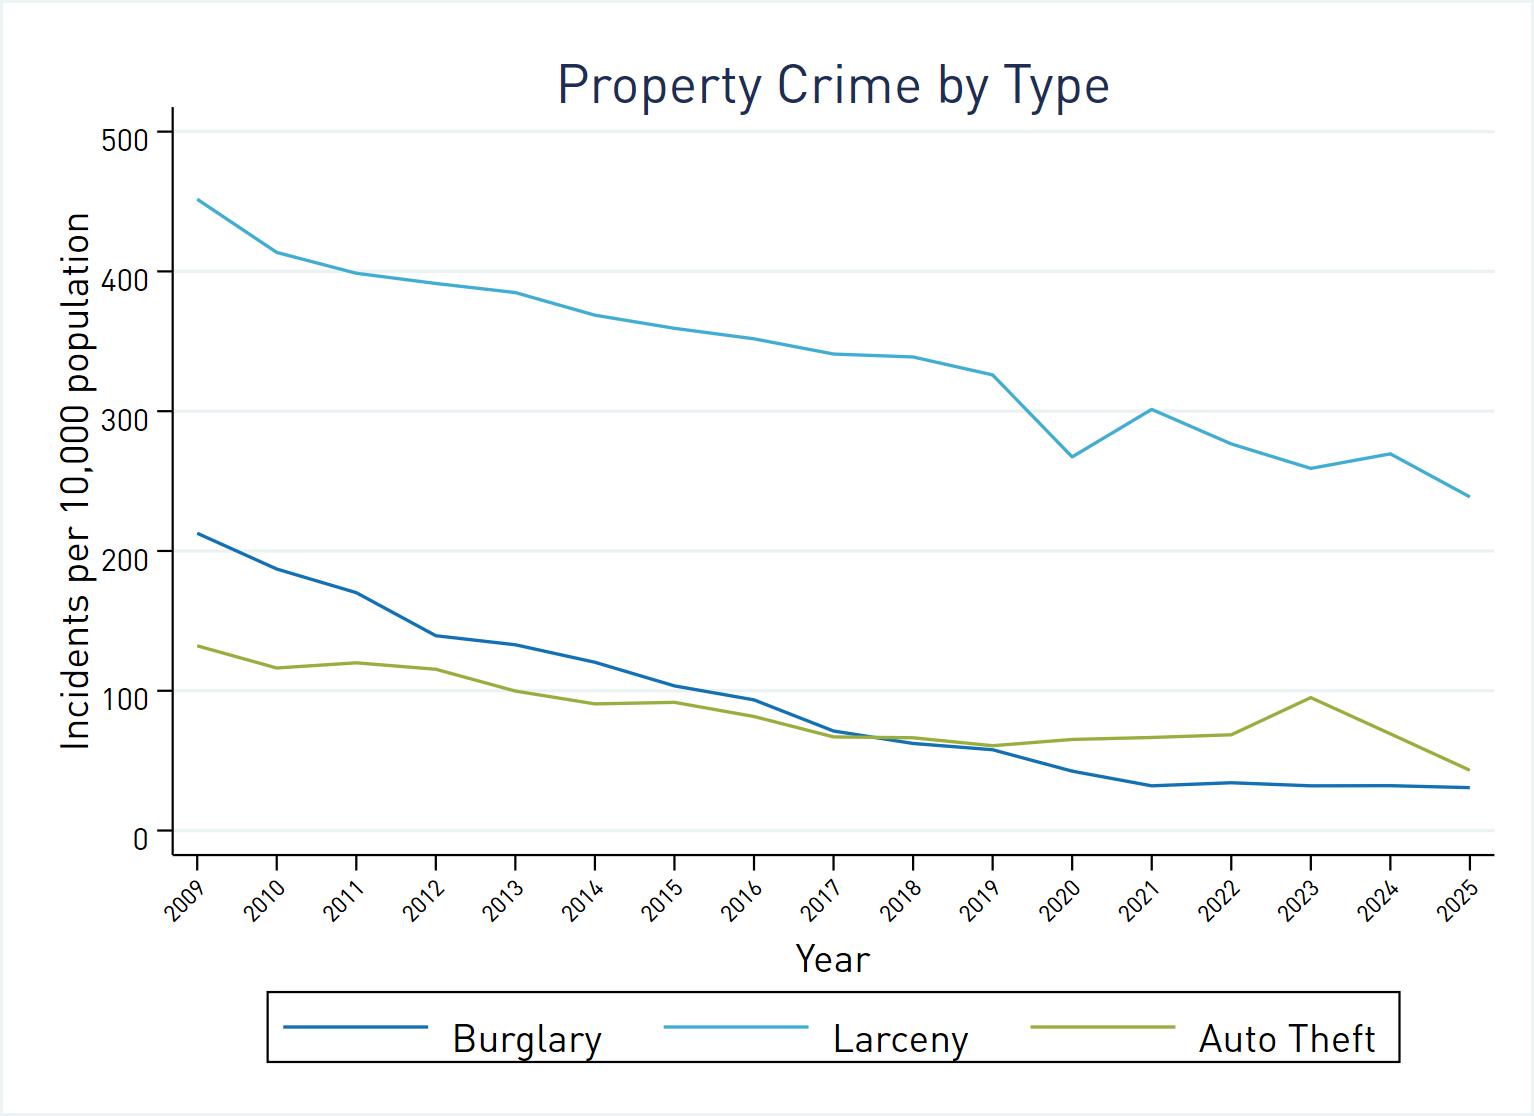
Data Source: Atlanta Police Department Open Data Portal
This graph shows that all three types of property crime declined over the time covered by our data. Larceny, the most common type of property crime, showed the greatest decrease, as measured by the slope of the trend line. It had a slight pandemic dip in 2020 as people stayed home. Burglary, which had been more common than auto theft through 2017, declined the second most and is now the least common type of property crime. Auto theft has had the smallest decline over the years covered by our data. Despite a bump in 2023 driven by the so-called “Kia Challenge“, auto theft is also at a historic low as of 2025.
How do property crime rates vary across the city, and how have they changed over time? Figure 3 shows property crime rates over time by Neighborhood Planning Unit (NPU).
Figure 3: Property Crime Rate by Neighborhood Planning Unit, 2009-2025
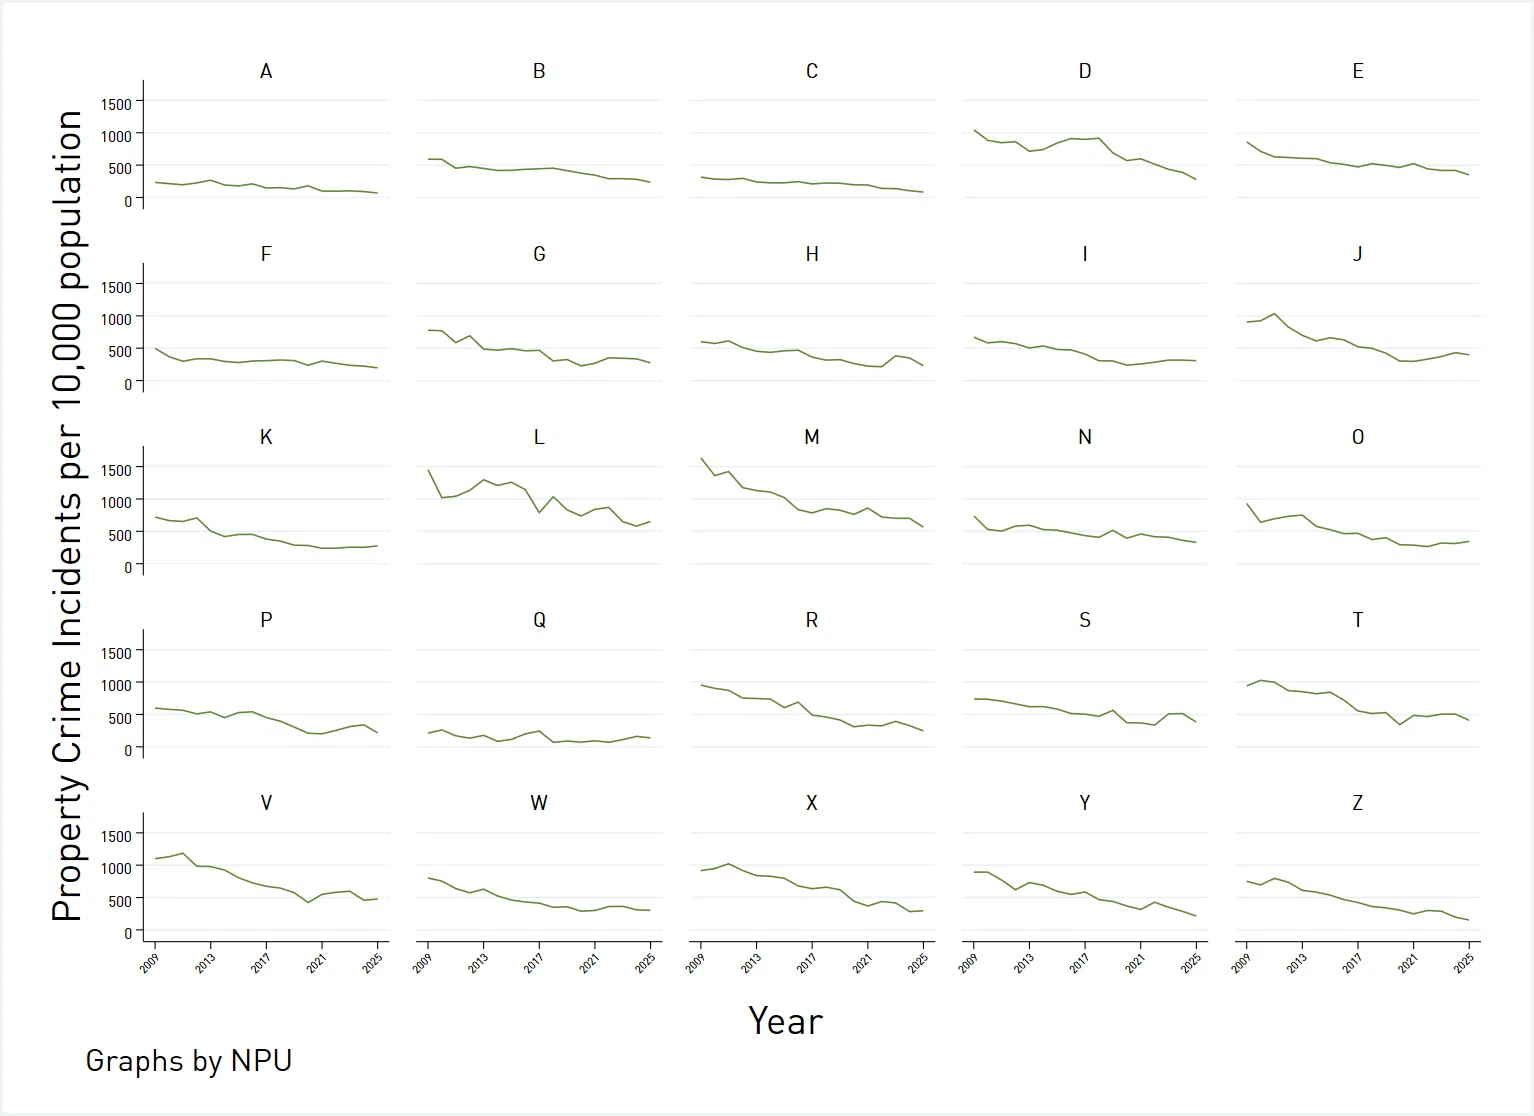
Data Source: Atlanta Police Department Open Data Portal
As we can see in this graph, property crime has declined in every NPU over the period covered by our data. Property crime is lowest in the NPUs on the northside that also enjoyed lower violent crime rates. The greatest decline in property crime rates (as measured by the slope of the trend line) has been in NPU M, followed by NPUs X, V, R, and L. By the same standard (not shown in graphs), NPUs B, Y, J, AND L showed the greatest improvement in burglary rates; NPUs M, D, O saw the greatest declines in larceny rates; and NPUs X, V, and R had the greatest improvement in auto theft rates.
In conclusion, Atlanta’s crime rates are at or near historic lows for all types of crime and across all parts of the city. This further debunks the ‘urban crime’ myth, at least in Atlanta’s case.
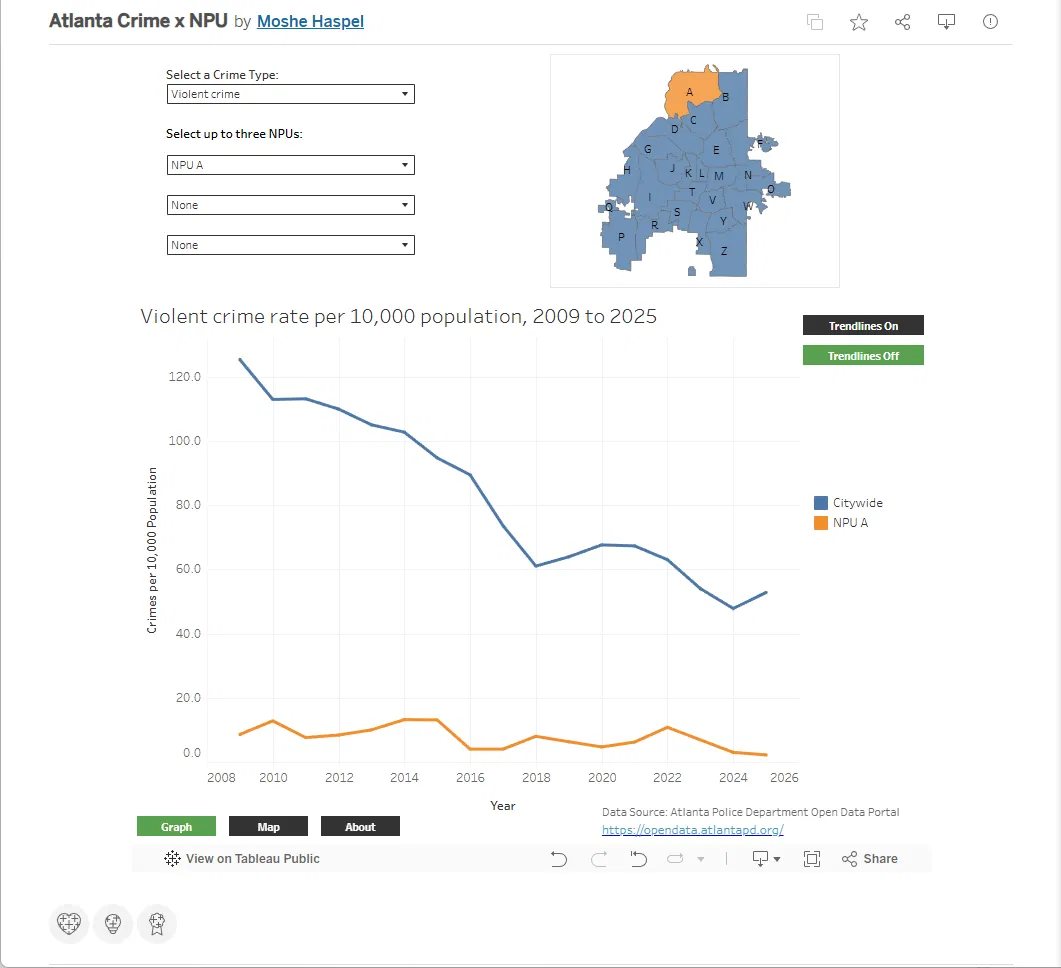
Want to explore further? We have updated our Atlanta crime visualization to include data through 2025: