Monday Mapday: Aging Immigrant Populations
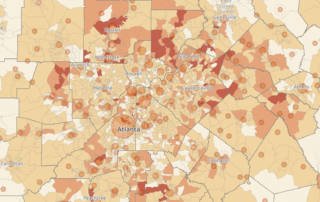
Our foreign-born population is older than you might think, on a percentage basis.

Our foreign-born population is older than you might think, on a percentage basis.
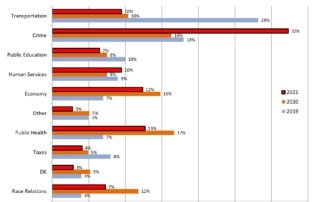
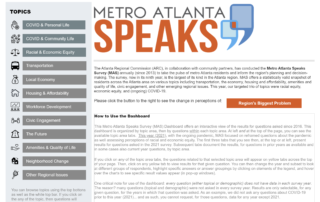
Metro Atlanta Speaks...we have given you most of the rest (v.v. tools to view the information), now check out the best (summary, that is).
Results for the 2021 Metro Atlanta Speaks survey were released yesterday as part of the State of the Region Breakfast. This post compiles all the places you can go to learn more about the attitudes and perceptions about life in the 11-county area, from high-level overviews to data exploration dashboards.
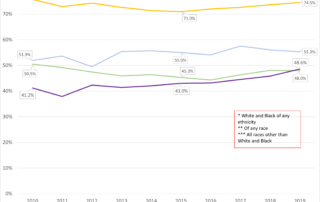
Hispanic homeownership grew from 2010 to 2019 across the Atlanta area, while the overall owner share was falling (and declining for both White and Black populations).
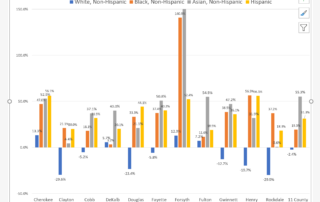
Our 2021 celebration of Hispanic culture in the 11-county metro continues with a look at the country of origin for our Hispanic residents.
This month (September 15-October 15) is Hispanic Heritage Month. We have a commemorative compendium of the latest data on this core growth component of our region's population. Installment 1 of 3 is current population trends!
Insights on demographic changes at the tract and city level, along with an interactive map allowing you to explore more.
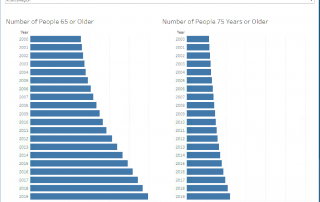
Introducing a new dashboard that visualizes change (total and by race/ ethnicity) over the last 20 years for regional and county 65+ and 75+ populations.
The Atlanta Black population's higher educational attainment has soared over the last fifty years. The share of Black higher ed degree holders has grown by 500 percent since 1970, besting the related share in the rest of the population, which grew by 350 percent.
Black-owned businesses make up a much larger share of the Atlanta metro business base than they do at the national level, and a relatively large share of these businesses are small.