Transportation Tuesday: Commuting between Counties
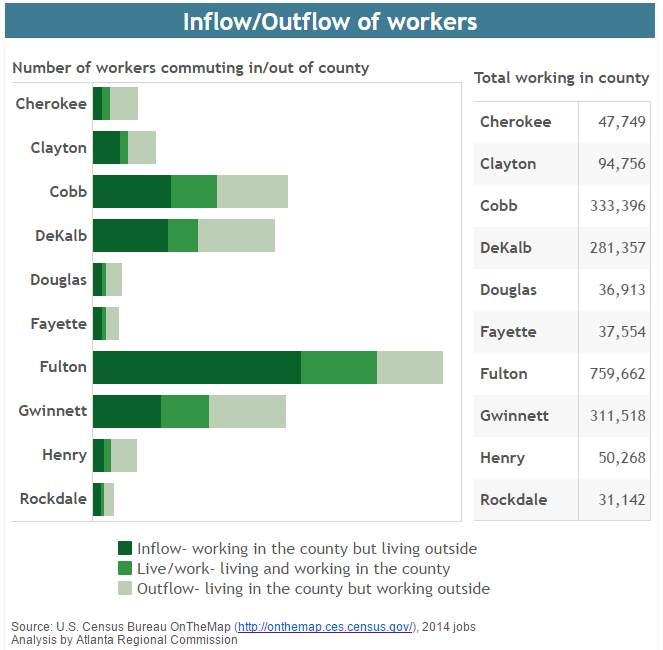
For each of the ten core metro Atlanta counties, this chart shows the number of workers that commute into the county for work but live elsewhere, that live and work in the county, and that live in the county but commute out for work.