Election Day is just 39 days away and there are only 12 days left to register to vote. We are taking a timely look at voter data from the last three Presidential elections. In 2012, there were a little over 3 million registered voters in the 23-county metro Atlanta region, and 2.2 million voted. As of September 1, 2016, there were 2.9 million registered voters in metro Atlanta. The charts below break down those numbers in more detail.
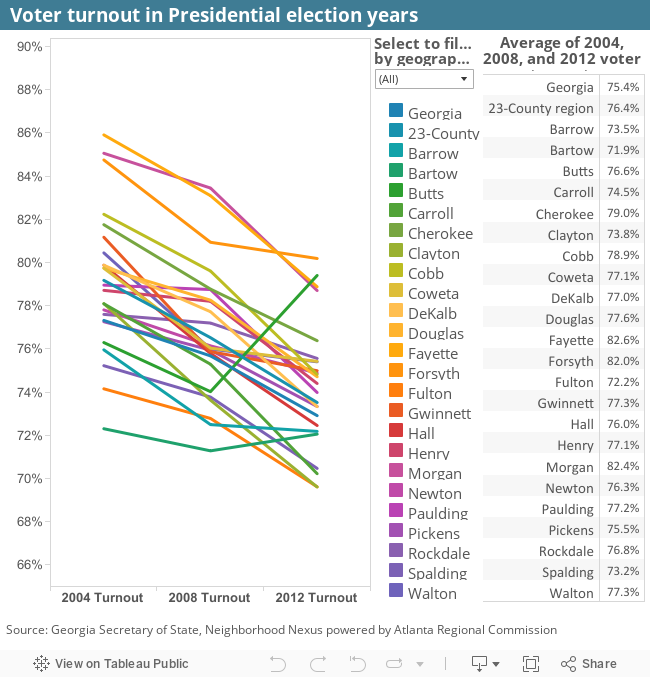
The Voter Turnout in Presidential Election Years interactive chart shows voter turnout for each county, in addition to the 23-county region and Georgia as a whole. Voter turnout is measured as the percentage of registered active voters who actually voted. In all but one county (Butts County), voter turnout declined from 2004-2012. The table shows the average voter turnout rate of the last three elections. Highlight counties in the legend or use the drop-down menu to limit the view to select counties.
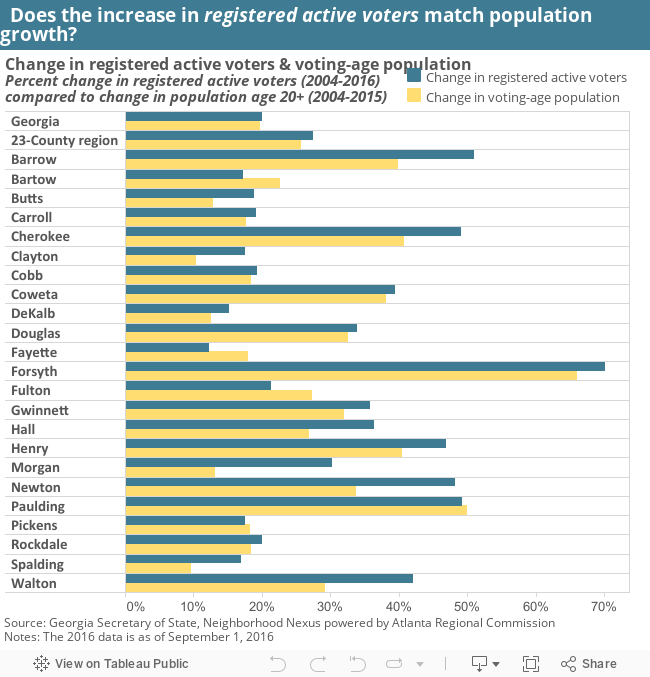
As population has increased throughout the years, more people have registered to vote. The blue bars in the chart below show change in voter registration from 2004-2016. For the 23-county region, voter registration has increased roughly 28% from the 2004 election. But is this increase keeping up with growth in the voting-age population?
Looking at the yellow bars, in the 23-county region the population age 20+ grew 26% from 2004 to 2015. Since we are not including ages 18 and 19, and since the data is only through year 2015, this is a conservative estimate of voting-age population, but shows that voter registration numbers have increased at a slightly faster pace than the voting-age population. For counties that have longer yellow bars compared to blue bars, the change in voter registration is falling short of the estimated increase in the voting-age population. In Fulton County, the voting-age population has increased 6 percentage points more than voter registration. In Walton County, voter registration has increased 13 percentage points more than the voting-age population.
In all but one county in 2004, 2008, and 2012, female voters had a higher turnout compared to male voters. Select the buttons next to the years to change the view in the line chart. Select a county to view the registration and turnout numbers.

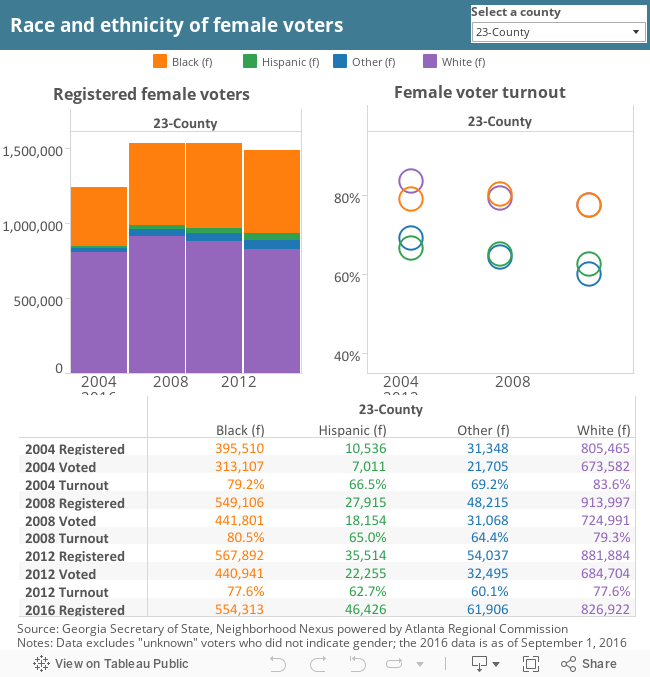
When looking at the race and ethnicity of female voters at the regional level, white and black women have the highest turnout rates. Select a county below to view corresponding turnout rates and registration numbers to see the differences in magnitude.
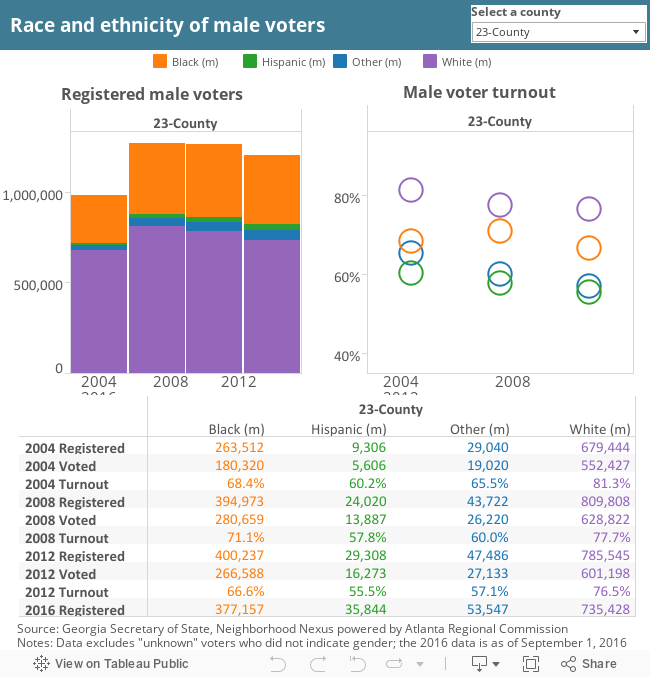
The chart below breaks down the race and ethnicity of male voters. At the regional level, white males have the highest levels of turnout.
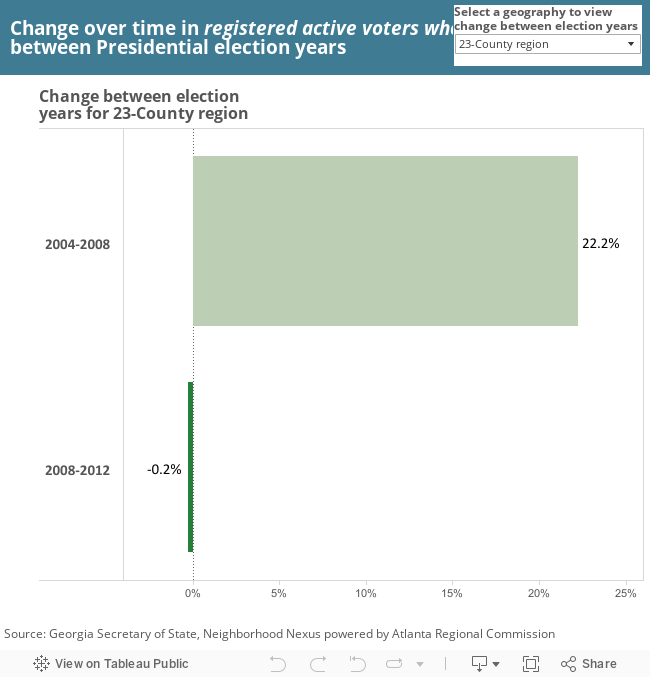
Comparing voter turnout rates from 2004-2012, every county except Butts decreases. However, looking at change-over-time shows an increase in the number of registered voters who actually voted, reflecting growth in voting-age population. Suburban counties in the metro region show the greatest change in registered voters who actually voted. The green bars show how the change breaks down between individual election years.