Monday Mapday: Reading Proficiency in Elementary Schools
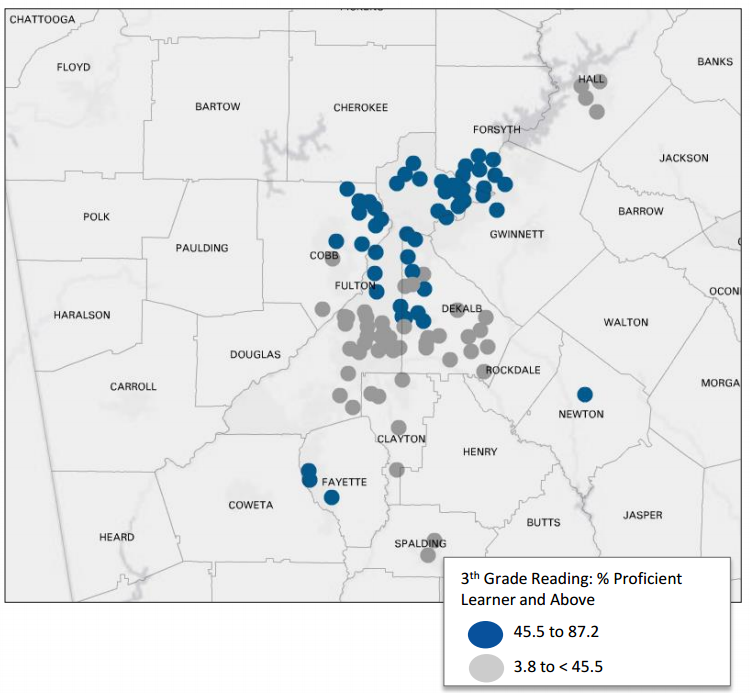
This map, from our latest Regional Snapshot: Reading Matters and Math Counts, shows the 50 schools with the highest reading proficiency (in blue) and the 50 schools with the lowest reading proficiency (in gray) in metro Atlanta. With the exception of schools in Fayette County and a couple of schools in northern DeKalb, Gainesville City, and Cobb, there [...]