Monday Mapday: Where do the Metro’s Unmarried Residents Live?
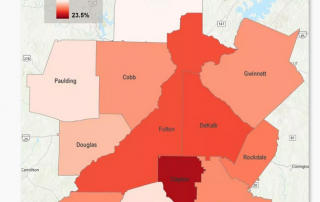
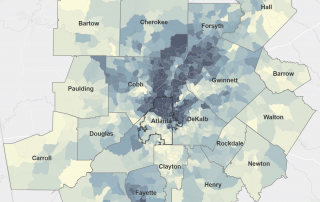
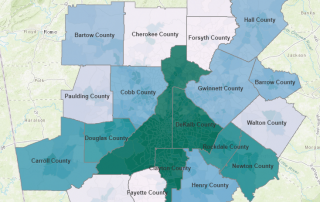
This Monday Mapday takes a look at what Metro Atlanta counties and Census tracts have high rates of unmarried residents.

This Monday Mapday takes a look at what Metro Atlanta counties and Census tracts have high rates of unmarried residents.
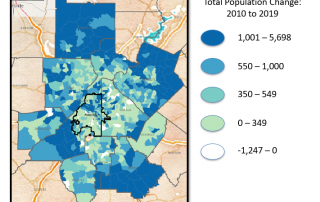
A look at population growth, changes in population density and housing building permits throughout the region.
This Monday Mapday takes a look at county and tract-level variation in rates of residents using three forms of social assistance: SNAP, cash assistance and Supplemental Security Income.
It's back-to-school season once again, so what better time to take a look at the population of children across the metro area? The maps that follow offer insight into which counties and Census tracts have the most children and provide clues about social conditions these kids might experience. Where do [...]
A series of interactive maps explores where metro Atlantans age 65 and older live, where they are more likely to be living in poverty and what areas of the metro see higher rates of older adults with a disability.
A look at county-level student loan debt and communities that have high debt despite not having greater-than-average rates of higher educational attainment.
The Fed recently found that 40 percent of Americans aren't able to handle a $400 emergency expense. This Monday Mapday uses Metro Atlanta Speaks data to consider how this plays out across the 13-county area.
A view into which Metro Atlanta counties are most likely to see residents skip or reduce the size of meals due to a lack of financial resources.
In celebration of Nurse's Week 2019, we're taking a look at the labor demand for the profession, as well as the current wage outlook for those in the industry.
College graduation season has begun! These maps show where the most residents with a bachelor's and beyond live and which degree categories are most popular.