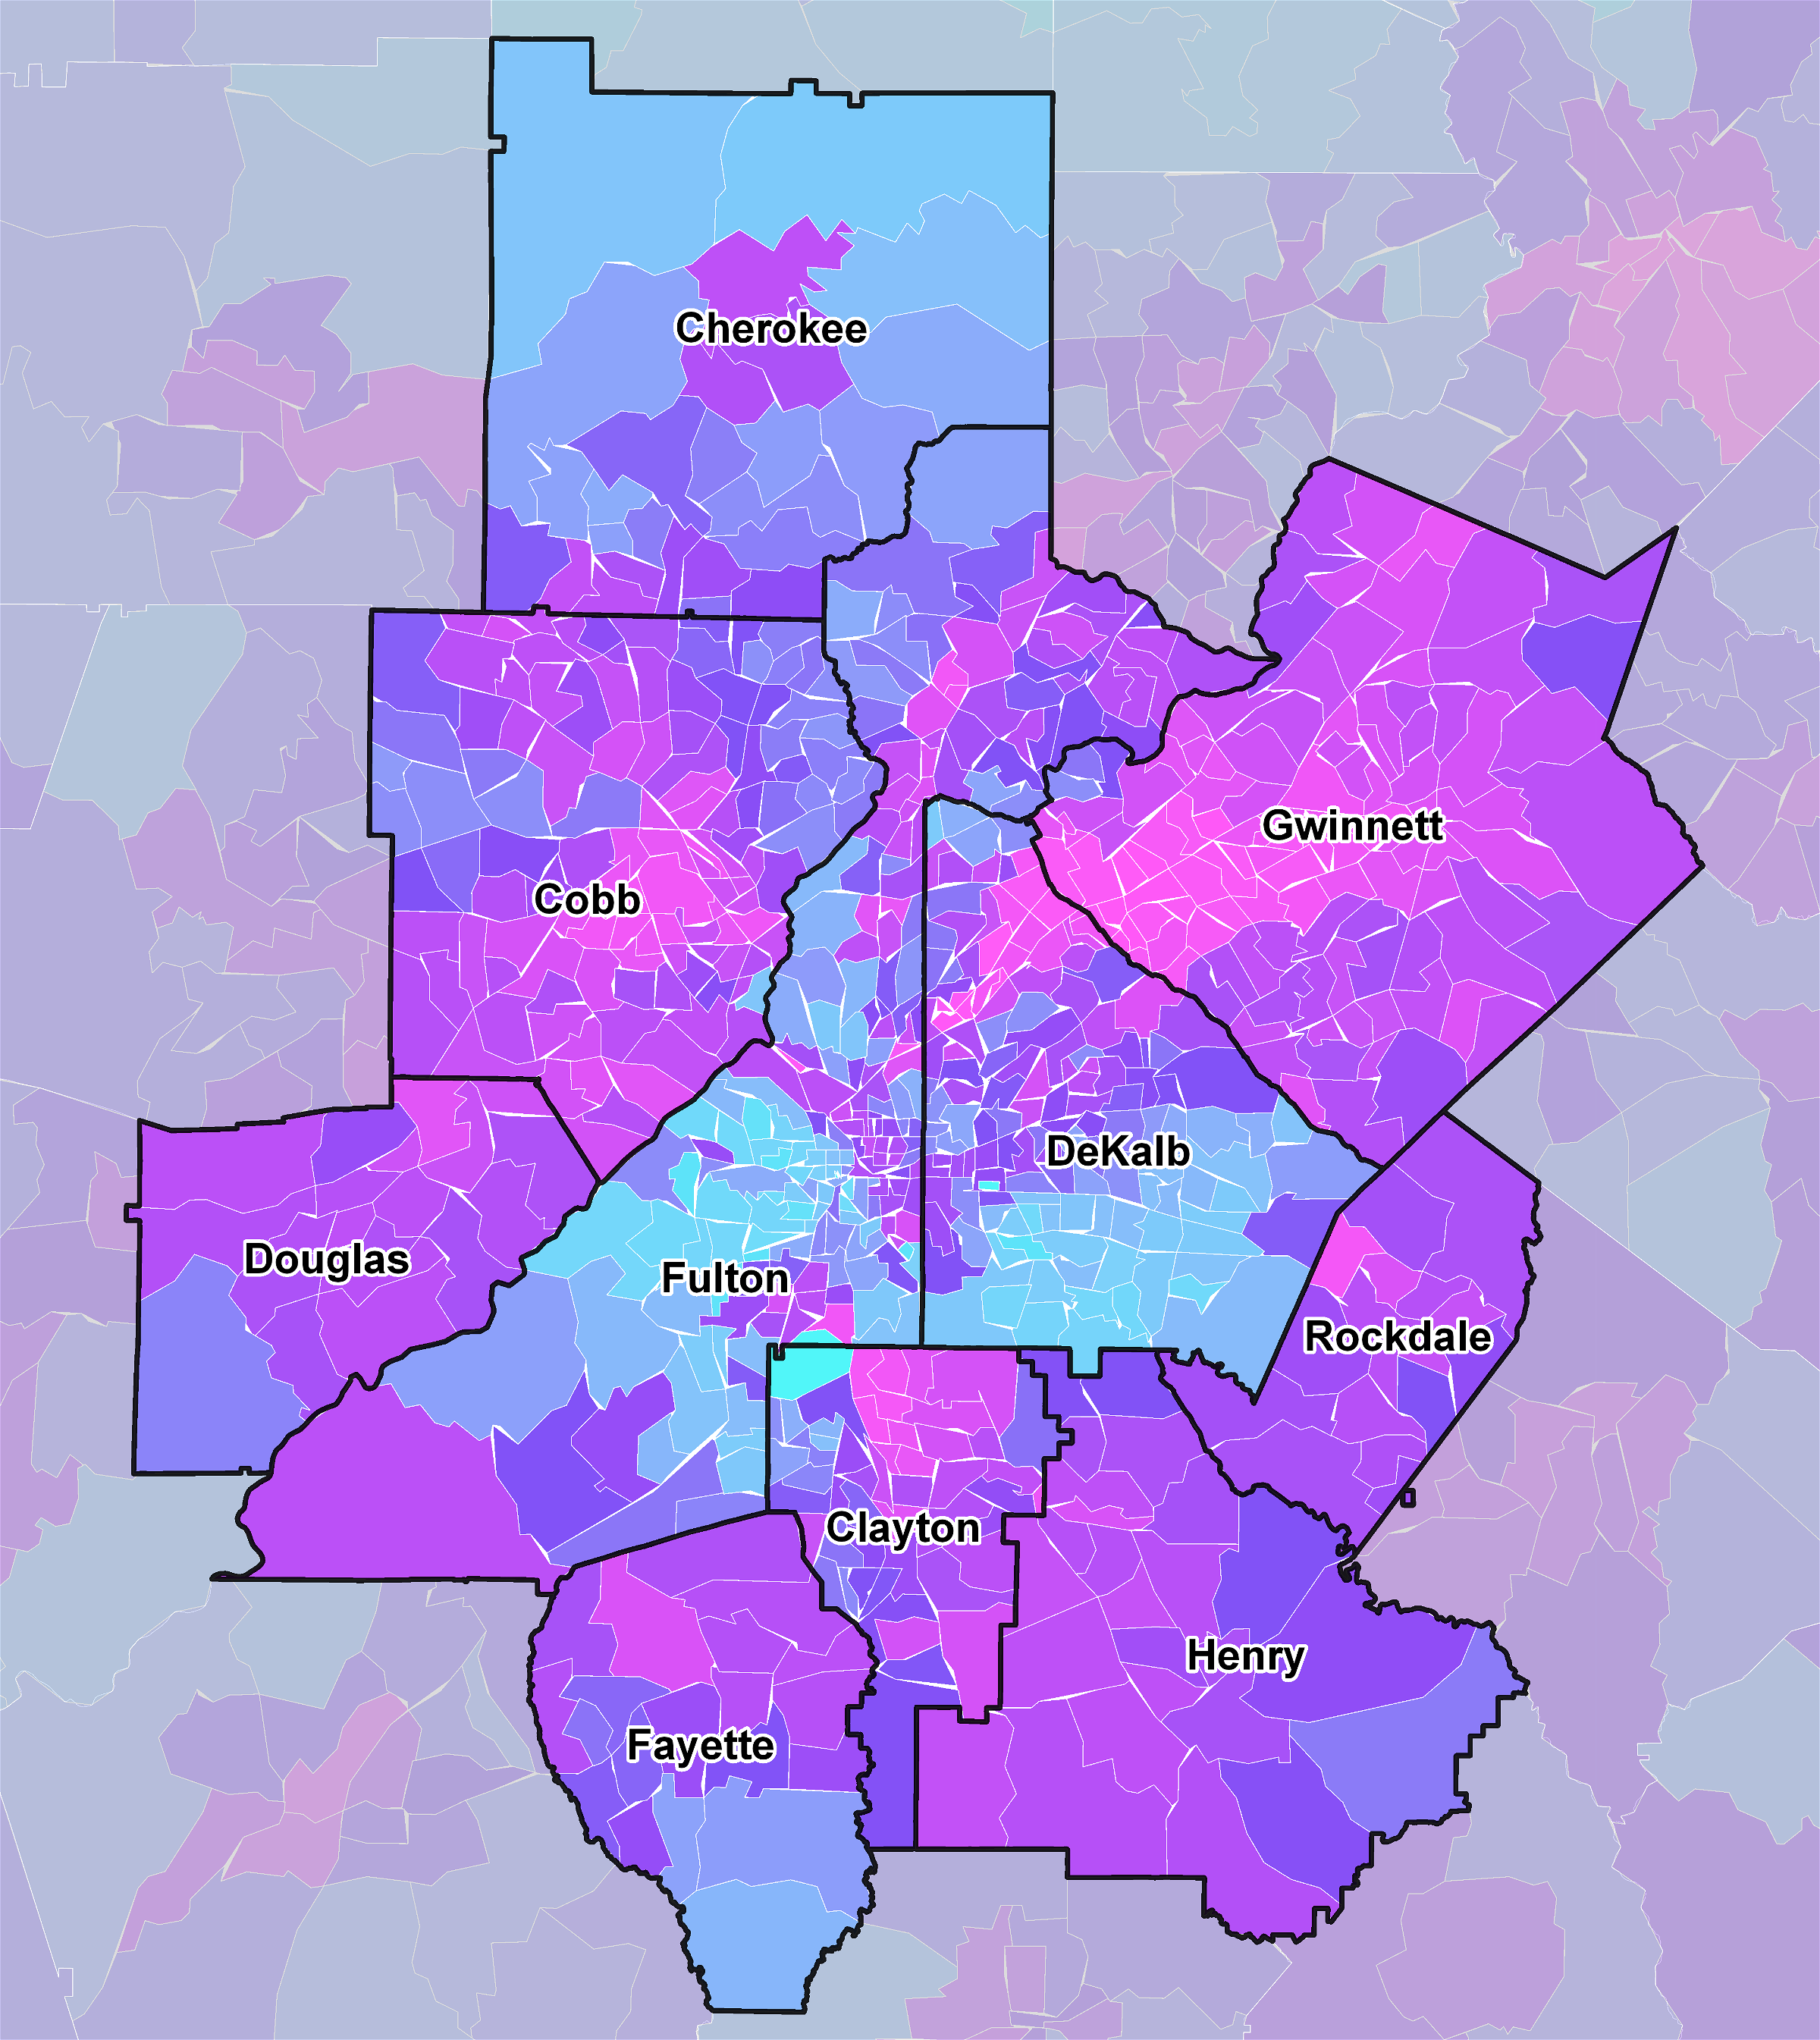
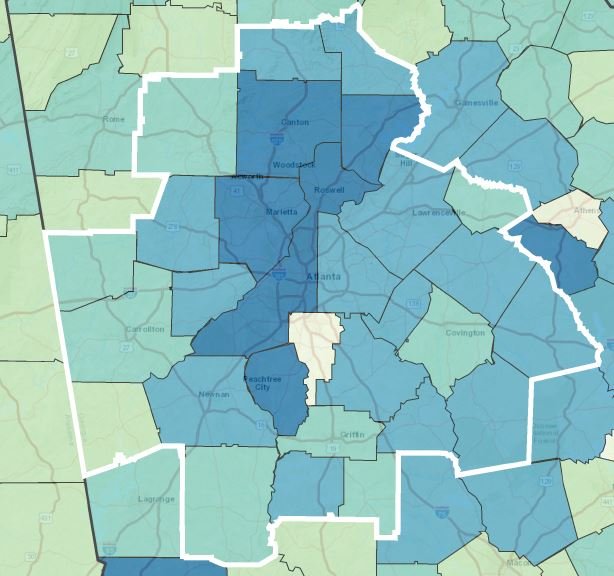
Friday Factday: ARC’s BIG Move

By |2019-01-23T11:35:13-05:00June 30th, 2017|Friday Factday|

On June 19th, 2017 ARC moved from its home of nearly 17 years at Loudermilk Center to our new digs in the International Tower at Peachtree Center. While we have many fond memories of our offices at Loudermilk, ARC is excited about our new home and hopes you'll visit us soon! In celebration of [...]

Comments Off on Friday Factday: ARC’s BIG Move

Regional Snapshot: Arts & Culture

By |2017-06-27T18:37:13-04:00June 27th, 2017|Economy, Regional Snapshot|

Beyond increasing our quality of life and enriching our culture, the Arts have a huge economic impact in metro Atlanta.​ The June 2017 Regional Snapshot takes a look at a recently released economic study, launches a new arts organization data dashboard, and shares related data and maps. Highlights: The nonprofit arts and culture industry [...]

Comments Off on Regional Snapshot: Arts & Culture

Monday Mapday: Population with No Health Insurance Coverage – 100 U.S. Metros

By |2019-01-23T11:39:04-05:00June 26th, 2017|Monday Mapday, Public Health|

This map compares the most recent healthcare coverage data from the U.S. Census Bureau for the 100 largest U.S. metro areas, showing the percentage of population with no health insurance coverage. The areas in blue are metros with the highest uninsured rates, where 11.7% - 31.0% of residents do not have health insurance. Source: [...]

Comments Off on Monday Mapday: Population with No Health Insurance Coverage – 100 U.S. Metros

Friday Factday: Spending and Jobs Supported by Nonprofit Arts and Culture Industry

By |2017-06-23T20:34:48-04:00June 23rd, 2017|Friday Factday|

The recently released Arts and Economic Prosperity 5 Study by Americans for the Arts estimates the economic impact of the nonprofit arts and culture industry for 341 communities throughout the U.S. The upcoming Regional Snapshot will take a closer look at this study and related data in metro Atlanta (10-county area). The charts below [...]

Comments Off on Friday Factday: Spending and Jobs Supported by Nonprofit Arts and Culture Industry

Monday Mapday: Location of Low-Income Workers vs. Low-Income Jobs

By |2019-01-23T11:39:58-05:00June 19th, 2017|Monday Mapday|

The maps below show a spatial mismatch between the location of low-income workers and low-income jobs.  The first map shows the location of the region’s low-income workers by place of residence, with blue shades representing areas with the highest concentration of low-income workers.  As depicted in the map, the region’s low-income workers are primarily [...]

Comments Off on Monday Mapday: Location of Low-Income Workers vs. Low-Income Jobs

Monday Mapday: Transportation Costs Complicate Affordability

By |2019-01-23T11:40:22-05:00June 12th, 2017|Housing, Monday Mapday|

How do transportation costs factor into affordable housing? When considering both housing and transportation costs, the window of affordability becomes even more narrow. These maps show where a family of four (two working commuters and two kids) that makes the area median income (approximately $57,000) can live if they want to pay less than [...]

Comments Off on Monday Mapday: Transportation Costs Complicate Affordability

Most and Least Affordable Areas for Housing Costs

By |2017-06-09T19:43:38-04:00June 9th, 2017|Friday Factday, Housing|

A recent CityLab article highlights the nationwide challenge to afford housing. In very few areas (only 12 counties) can a worker making minimum wage and working 40 or fewer hours a week afford rent for a one-bedroom unit. "Affordability" is defined as paying less than than 30% of a household income for housing costs (for both [...]

Comments Off on Most and Least Affordable Areas for Housing Costs

Monday Mapday: Change in Low Birthweight Births

By |2019-01-23T11:40:40-05:00June 5th, 2017|Monday Mapday, Public Health|

This map shows the areas (by Census Tract) that have had the greatest increase in rates of low birthweight births (where the infant weights less than 2,500 grams or 5.5 pounds), a key indicator of maternal and infant health. The data measures the change in birth rates from 2000-2004 (an average for the 5 year [...]

Comments Off on Monday Mapday: Change in Low Birthweight Births

Friday Factday: Metro Population Forecasts

By |2019-01-23T11:46:29-05:00June 2nd, 2017|Forecasts, Friday Factday, Population|

Currently, metro Atlanta’s population of nearly 5.8 million ranks it ninth among the 10 largest U.S. metros.  However, over the next 30 years, recently released third-party forecasts predict that metro Atlanta will move into the 6th spot on that list, with a total population exceeding 8.6 million (and potentially as high as 9.1 million), [...]

Comments Off on Friday Factday: Metro Population Forecasts

Atlanta #1 Among Largest U.S. Metros for Over-the-Year Employment Growth in April

By |2019-01-23T11:49:09-05:00June 1st, 2017|Economy, Special Features|

In April 2017, nonfarm employment growth for the Atlanta-Sandy Springs-Roswell, GA Metropolitan Statistical Area (MSA) was up 3.3% over the year, placing Atlanta first among the 12 largest U.S. metros in over-the-year percent change in nonfarm employment.  This growth is a reflection of percentage change gains among the region's higher-paying industry sectors, including Construction [...]

Comments Off on Atlanta #1 Among Largest U.S. Metros for Over-the-Year Employment Growth in April
Go to Top