Friday Factday: Homeownership and Household Formation Among Millennials
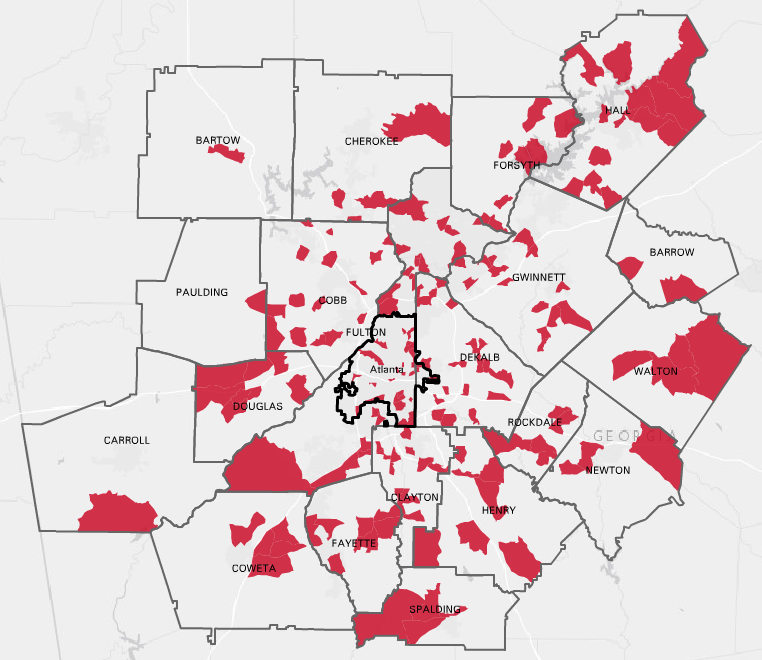
Nationally, the country is experiencing a delay in household formation among the millennial generation, as well as declining homeownership rates. This week's Friday Factday explores these trends in the 10-county metro area. In terms of homeownership, rates are way down in metro Atlanta - for all age categories, but especially among millennials (as shown [...]