Monday Mapday: Native Americans in the Metro Region
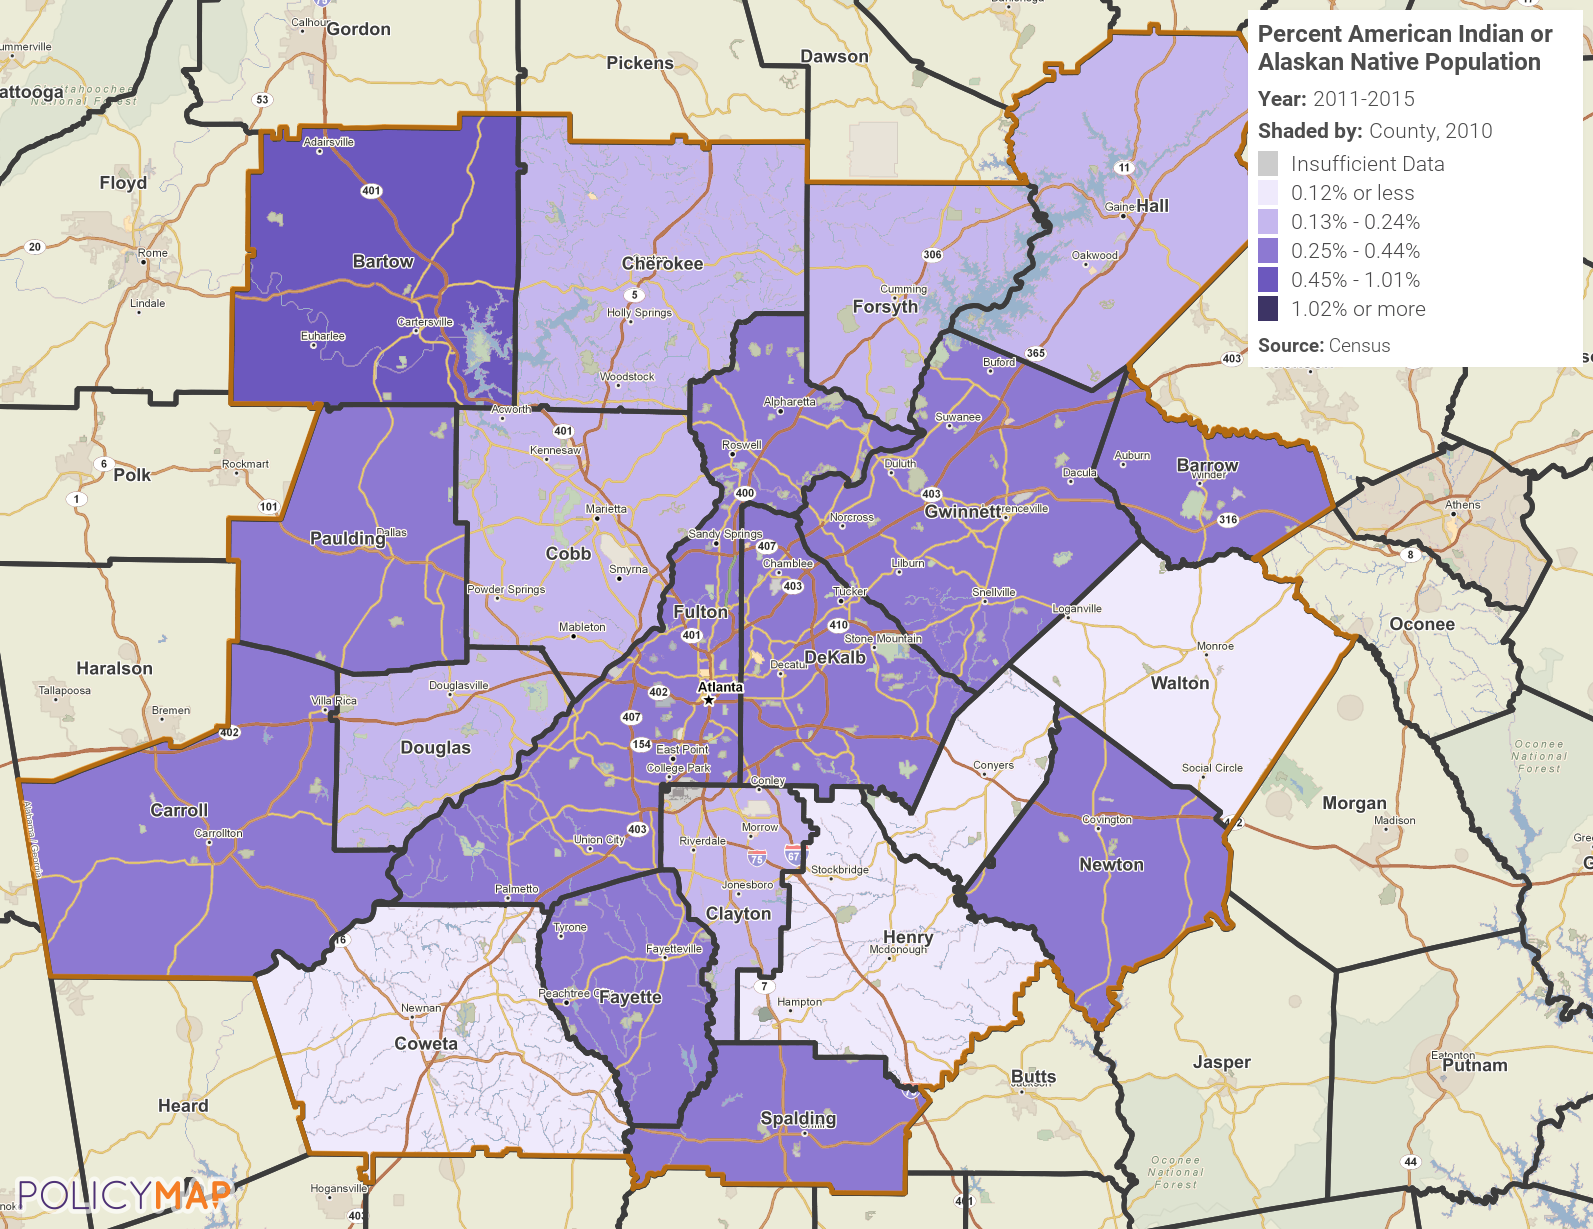
In 1990, President George H.W. Bush signed a joint congressional resolution to designate November 1990 as "National American Indian Heritage Month." Since 1994, similar presidential proclamations have been issued every year. Today, the month is recognized as "American Indian and Alaska Native Heritage Month." The map below provides an estimate of the American Indian [...]