
Monday Mapday
Maps showing themes and trends, published on Mondays

Monday Mapday: Georgia Milestones Assessment
Many Georgia schools are taking the 2016 Georgia Milestones Assessments this week, so we decided to take a look at last year's assessments for 3rd grade English Language Arts (ELA). This map shows public schools in [...]

Monday Mapday: Job-to-Worker Ratios
This map shows census tracts in metro Atlanta with high job-to-worker ratios (ratios of 1.9 to 40) using 2014 Longitudinal Employer-Household Dynamics data from the U.S. Census Bureau. This ratio helps to understand the job/worker [...]

Monday Mapday: 2016 County Health Rankings, Health Behaviors
This Monday we wanted to highlight a few findings from our last post about the 2016 County Health Rankings. Looking at health behaviors by county, specifically percent of adults who smoke and percent of adults [...]

Monday Mapday: 2016 County Health Rankings
The new 2016 County Health Rankings (https://www.countyhealthrankings.org/) rank each county based on health outcomes (length of life and quality of life) and health factors (health behaviors, clinical care, social and economic factors, and physical environment). [...]
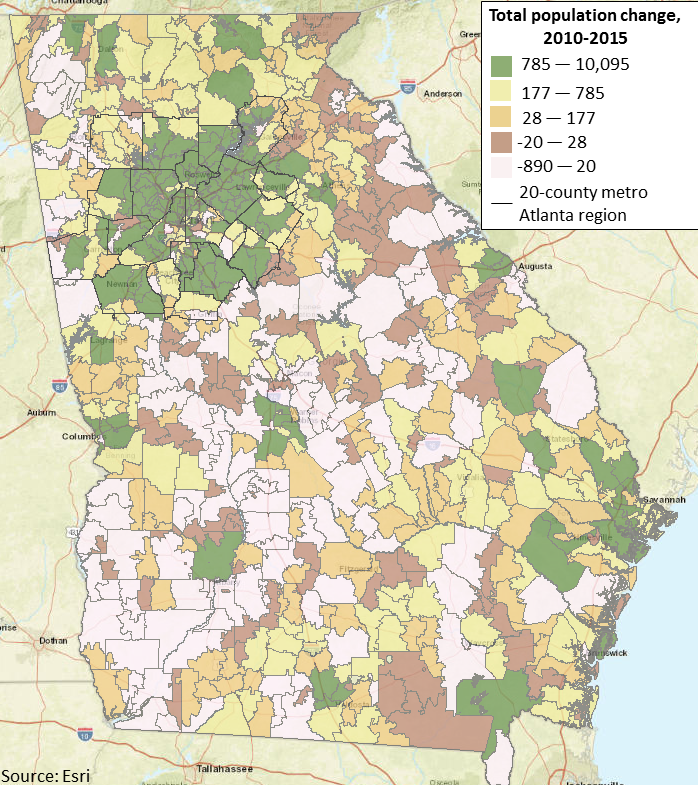
Monday Mapday: Georgia’s Population Change by Zip Code
This map shows total population change by zip code throughout Georgia from 2010-2015. The zip codes in green have had the greatest amounts of population growth while areas in pink have seen a loss in population. [...]

Monday Mapday: Earned Income Tax Credit (EITC)
The countdown to Tax Day is on! In honor of the countdown, this map shows the change in the percentage of tax returns claiming the Earned Income Tax Credit (EITC) from 2011-2013 by zip codes [...]