
Monday Mapday
Maps showing themes and trends, published on Mondays

Monday Mapday: Building Permit Activity
This map shows the top twenty metros that had the greatest increase in building permits submitted in 2015 (through September) compared to the same time period in 2010. The metros in darker circles had the [...]

Monday Mapday: Average Family Size
In metro Atlanta, the average family size is 3.41 (a "family" consists of at least two people living in the same household who are related by birth, marriage, or adoption). This map shows the neighborhoods in [...]

Monday Mapday: Rental Affordability in Georgia Cities
We recently looked at housing affordability in metro areas across the U.S. and in neighborhoods in metro Atlanta. This map shows the cities in Georgia where 52 percent or more of housing units are occupied by renters, [...]

Monday Mapday: Hispanic Population Change in House Districts
Many parts of the state, especially in metro Atlanta, have experienced growth in the Hispanic population. This map takes a look at this population change from 2000-2010 in Georgia State House districts (U.S. Census Bureau [...]
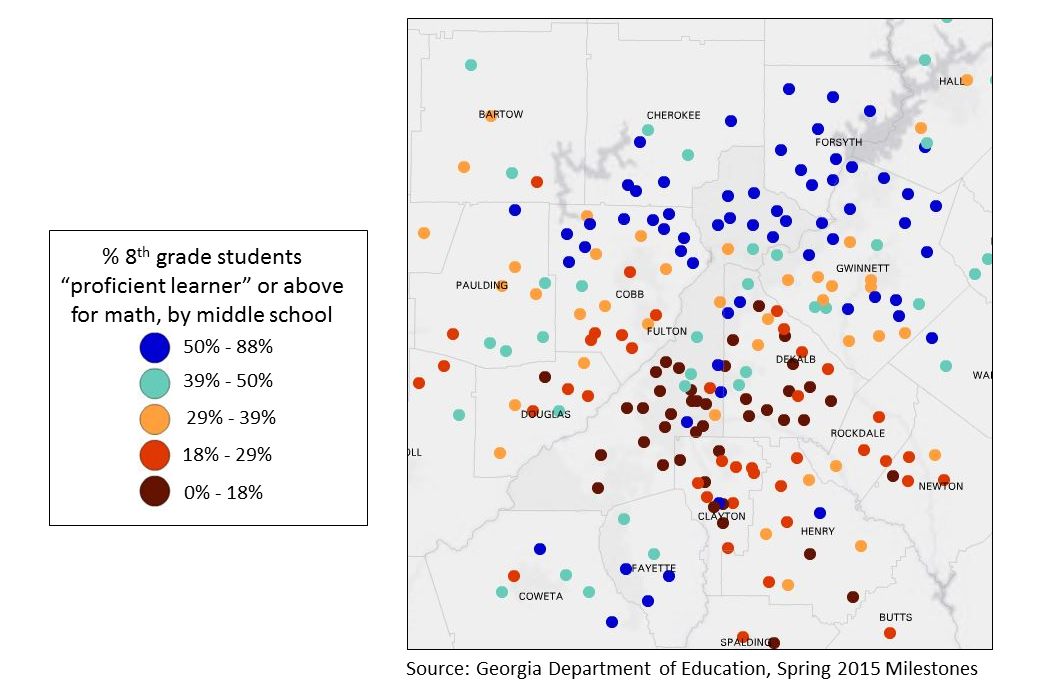
Monday Mapday: Middle School Math Milestones
Georgia Milestones is an assessment used by the Georgia Department of Education that replaced the CRCT (Criterion-Referenced Competency Tests) in the spring of 2015. The Milestones test includes various subjects- this map looks at 8th [...]

Monday Mapday: Increase in Teen Births
In most parts of metro Atlanta, teen birth rates have been decreasing. This map looks at the change in birth rates from 2000-2004 (an average for the 5 year period) to 2010-2014 (another average). The red [...]