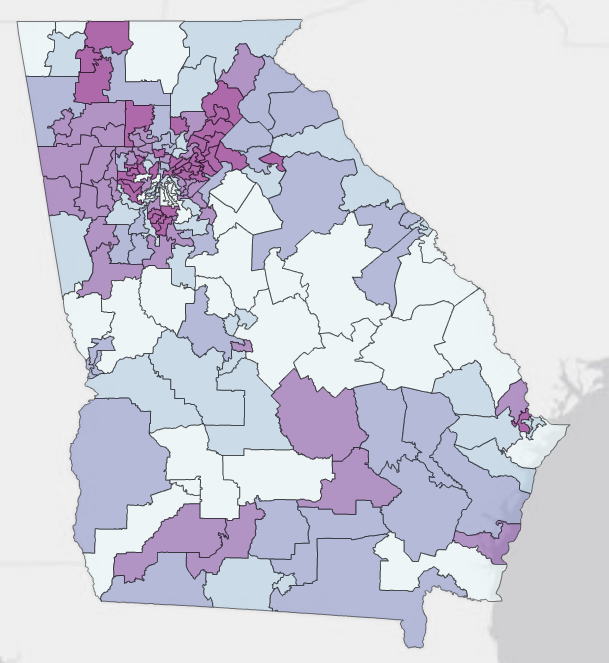
Many parts of the state, especially in metro Atlanta, have experienced growth in the Hispanic population. This map takes a look at this population change from 2000-2010 in Georgia State House districts (U.S. Census Bureau data via Neighborhood Nexus). Throughout the state, metro Atlanta has seen some of the greatest increases in Hispanic population (dark purple on the map).
Click on the image to view the next map of House districts in metro Atlanta. In the Atlanta region, House districts in Gwinnett, Hall, Barrow, Clayton, and Cobb counties have experienced the greatest percentage growth in Hispanic population.
Change in percent Hispanic population, 2000-2010