The Owner/Renter Landscape: Past and Present
Exploring past trends and the present landscape of owner and renter housing in the 10-county area.

Exploring past trends and the present landscape of owner and renter housing in the 10-county area.
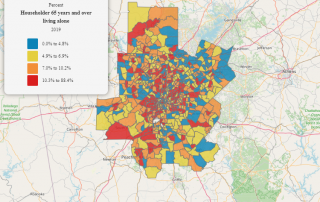
The number of seniors living alone has increased since 2000. This is the result of demographic trends and longer life expectancies, but it does present service delivery challenges that can't be ignored.
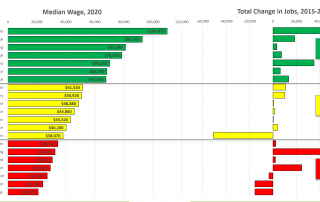
A whirlwind look at wage trends (high, middle, low) pre- and post-pandemic...nationally and locally
A mapping application exploring how current opportunity zones intersect with historical redlining maps.
About a third of Atlanta households are defined as cost-burdened (spending more than 30 percent of income on housing). BUT those cost burdens go up...a lot...for renters, for lower-earners, or (especially) for lower-income renters.
The Atlanta Black population's higher educational attainment has soared over the last fifty years. The share of Black higher ed degree holders has grown by 500 percent since 1970, besting the related share in the rest of the population, which grew by 350 percent.
Interactive maps taking a look at how the distribution of Georgia's Non-Hispanic Black population has changed since 2010.
A comparison of jobs between Q1 and Q2 of 2019 and 2020, and a look at unemployment rates in the course of 2020, reveal the depth of the pandemic's impact on our economy.
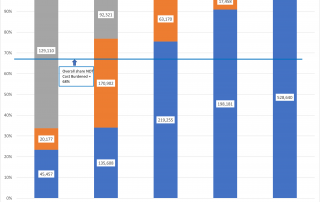
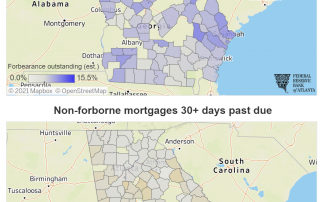
A quick look at what we learned using the Atlanta Fed's Mortgage Analytics and Performance Dashboard.
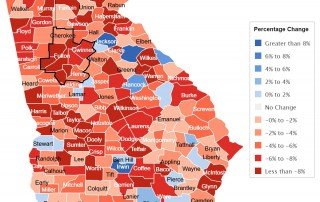
A new U.S. Census mapping product examines the percent difference in state tax revenue streams between 2019 and 2020.