Where is Santa headed?
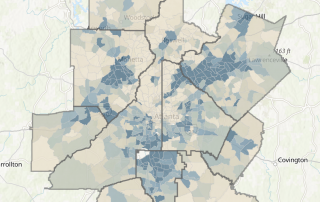
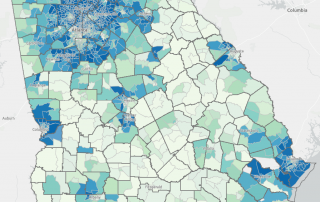
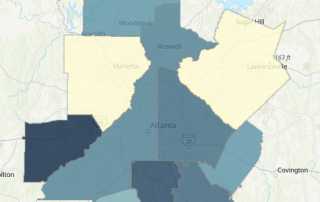
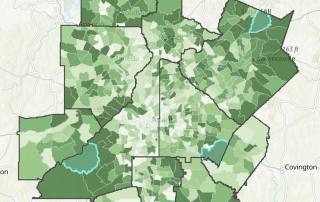
Perhaps better titled "Where will Santa be stressed?" Some maps showing population numbers of children age 9 and younger, where Santa's gonna be working double time to execute his all-important annual job.

Perhaps better titled "Where will Santa be stressed?" Some maps showing population numbers of children age 9 and younger, where Santa's gonna be working double time to execute his all-important annual job.
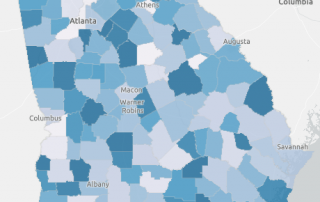
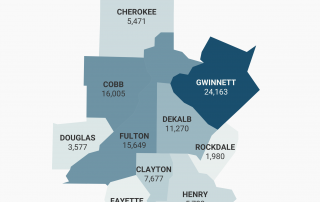
Celebrating Family Caregivers Month with a look at rates of grandparents who are caring for their grandchildren.
Georgia is a melting pot of different cultures. This interactive map visualizes the foreign-born across the state, and an accompanying chart shows the continent of origin for immigrants to the 10-county area.
How have rates of the uninsured changed over time? A look at differences between 2010, 2015 and 2019, with a small area map showing which Census tracts see the greatest rate of uninsured residents.
Our usual fall traditions might be on hold, but mother nature's most brilliant offering — the annual changing of the leaves — is still on, with Atlanta expected to see the most color between October 26 and November 2.
Looking at the spatial distribution of Paycheck Protection Program loans below and above $150,000.
A tract-level look at broadband access across the state, as well as the rates of school-age children in each tract.
A county-level look at rates of grandparents living with grandchildren across the state of Georgia.
This Monday Mapday explores the location of students whose learning needs may be most impacted by virtual instruction.
In honor of the 30th anniversary of the Americans with Disabilities Act, this Monday Mapday takes a look at the rates of disabled Americans at the county and tract level.