About ARC Research

This author has not yet filled in any details.
So far ARC Research has created 361 blog entries.

Monday Mapday: Oldest and Youngest Neighborhoods

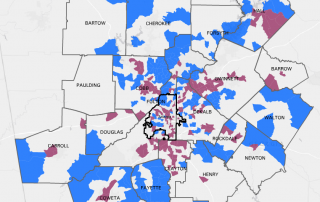
Using median age from the 2010 U.S. Census, this map shows the "youngest" neighborhoods in purple (median age ranging from 16.1 to 31.3) and the "oldest" neighborhoods in blue (a median age ranging from 39.6 to 52.7). The areas with a youngest median age are primarily concentrated in the core counties of Fulton, Clayton, DeKalb, [...]

By |2016-12-08T15:24:47-05:00December 5th, 2016|Age and Generations, Monday Mapday|Comments Off on Monday Mapday: Oldest and Youngest Neighborhoods

Poverty rates decreasing following a 2012 peak

In 2015, 14.1% of residents in the 10-county metro Atlanta region were living in poverty. When looking at rates from 2006 - 2015, all but one county in the region hit a peak poverty rate in 2012. There are stark differences in poverty rates throughout the region, with a 2015 high in Clayton County of 23.3%, [...]

By |2016-12-08T15:24:47-05:00November 29th, 2016|Economy, Special Features|Comments Off on Poverty rates decreasing following a 2012 peak

Monday Mapday: Senior Population

This map shows the neighborhoods in metro Atlanta that have the highest densities of senior residents (age 65+). In these neighborhoods, at least 25% of households have an individual age 65 or older. These areas are fairly spread out throughout the region, with high concentrations in suburban counties such as Spalding, Fayette, Newton, Walton, and [...]

By |2016-12-08T15:24:47-05:00November 28th, 2016|Age and Generations, Monday Mapday|Comments Off on Monday Mapday: Senior Population

The Food Insecure in Metro Atlanta – A Deep Dive into Metro Atlanta Speaks

For most of us, Thanksgiving is a time to celebrate with our families over an abundance of food and reflect on the many reasons we have to give thanks. Whatever the particular traditions are, food is usually a centerpiece. But as our recent Metro Atlanta Speaks survey shows, food isn’t always a given. In fact, [...]

By |2016-12-08T15:24:47-05:00November 23rd, 2016|Metro Atlanta Speaks, Special Features|Comments Off on The Food Insecure in Metro Atlanta – A Deep Dive into Metro Atlanta Speaks

Monday Mapday: Kids Without Health Insurance

In metro Atlanta, 9.1% of people under 18 do not have health insurance (an average from 2010-2014 for the MSA, using U.S. Census Bureau American Community Survey data via Neighborhood Nexus). This map shows the areas in metro Atlanta that have the highest percentage of uninsured youth. The red areas have the highest rates, with [...]

By |2016-12-08T15:24:48-05:00November 21st, 2016|Monday Mapday, Public Health|Comments Off on Monday Mapday: Kids Without Health Insurance

Transportation Tuesday: Affordability

These maps show areas in metro Atlanta that are most affordable (considering transportation and housing costs) for five different scenarios of family composition and income: A median-income family of four A working individual earning 50% of median regional income A retired couple at 80% of median regional income A single-parent family of three earning 50% [...]

By |2016-12-08T15:24:48-05:00November 15th, 2016|Housing, Transportation, Transportation Tuesday|Comments Off on Transportation Tuesday: Affordability

Monday Mapday: Early Voting Turnout

Election Day is tomorrow and 46% of registered active voters in the 20-county metro Atlanta region have already voted. This map shows the percentage of registered active voters who early voted in each county. Forsyth County had the highest early voting turnout at 62% and Bartow County had the lowest turnout at 37%. The counties [...]

By |2016-12-08T15:24:48-05:00November 7th, 2016|Monday Mapday|Comments Off on Monday Mapday: Early Voting Turnout

2016 Metro Atlanta Speaks Survey Results- Regional Snapshot

Transportation Remains Region’s Top Concern, According to 2016 Metro Atlanta Speaks Survey Atlanta Regional Commission's 2016 Metro Atlanta Speaks survey results were recently released, which document the perceptions of 5,400 residents in a 13-county area on topics including transportation, education, the economy, civic engagement, quality of life, and arts/culture. One of the questions asks respondents what [...]

By |2016-12-08T15:24:48-05:00November 3rd, 2016|Metro Atlanta Speaks, Regional Snapshot|Comments Off on 2016 Metro Atlanta Speaks Survey Results- Regional Snapshot

Transportation Tuesday: Transportation remains metro Atlanta’s top concern

According to the 2016 Metro Atlanta Speaks survey, 25 percent of respondents said transportation was the biggest problem facing the Atlanta region, the third straight year this topic topped the list of residents’ concerns. The results of the survey were just released, offering a statistically valid snapshot of residents’ views on a range of critical issues, [...]

By |2016-12-08T15:24:49-05:00November 1st, 2016|Metro Atlanta Speaks, Transportation Tuesday|Comments Off on Transportation Tuesday: Transportation remains metro Atlanta’s top concern

Monday Mapday: Income by Senate Districts

With Election Day quickly approaching, let's take a look at our Georgia Senate Districts. This map shows median household income by Senate Districts in metro Atlanta counties. This map is similar to other income-based maps, with north Fulton, Forsyth, Cobb, and Cherokee counties having the highest median income levels. Some areas, most notably in Gwinnett [...]

By |2016-12-08T15:24:49-05:00October 31st, 2016|Monday Mapday|Comments Off on Monday Mapday: Income by Senate Districts
Go to Top