Friday Factday: African-American History Month
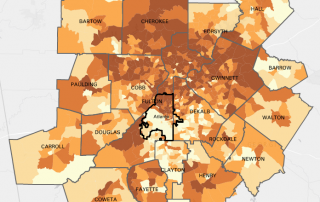
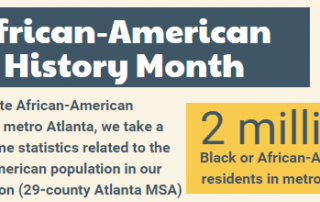
To celebrate African-American heritage in metro Atlanta, we take a look at some statistics related to the black population in our metro region (29-county Atlanta MSA):

To celebrate African-American heritage in metro Atlanta, we take a look at some statistics related to the black population in our metro region (29-county Atlanta MSA):
How have the levels of educational attainment changed in metro Atlanta? The February 2017 Regional Snapshot looks at changes in educational attainment throughout the past decade on the metro, county, and local levels. Highlights: About 37 percent of adults in metro Atlanta have at least a bachelor’s degree, which ranks in the top [...]
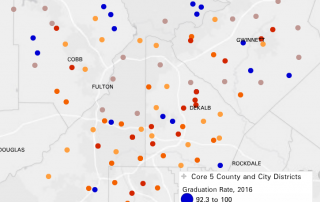
This map shows the range of 2016 high school graduation rates for schools in the five core counties and their city school districts. To view an interactive map and view other school-level variables, check out the Weave map on Neighborhood Nexus.
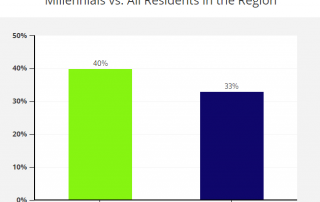
Many of us probably think millennials cope with financial stresses easily because of their education and improving job prospects. We took a look at the local level of financial stress in the 2016 Metro Atlanta Speaks (MAS) Survey by asking respondents "If you had to come up with $400 for an unexpected emergency, how would you pay?" [...]
Atlanta vs. Boston How does Atlanta compare to Boston? We'll let the football facts be decided on the field, but we check out some socioeconomic and demographic numbers here. For more on the 2017 Data Bowl, visit Atlanta Regional Commission's News Center.
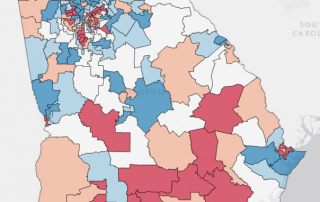
Neighborhoods in Gwinnett County ranked the most diverse in the state Metro Atlanta is becoming increasingly diverse, a change that can be seen in local school districts, the racial/ethnic makeup of millennials, and racially diverse neighborhoods. The maps that follow use Esri's Diversity Index to capture the racial and ethnic diversity of individual census [...]
With today being the start of Georgia's 2017 Legislative Session, let's take a quick look at one topic that is sure to be discussed- health insurance. In Georgia, 13.9% of people do not have health insurance coverage (U.S. Census Bureau American Community Survey 2015 1-Year Estimates). This map shows the percentage of population that [...]
An Updated Analysis of Wages in Metro Atlanta Nationally, metro Atlanta has fairly high wages, especially when considering its low cost-of living. But overall wage growth has stagnated since 2010… especially in middle-wage jobs. In fact, when compared to a set of peer metro areas, growth in middle-wage occupations in metro Atlanta is [...]
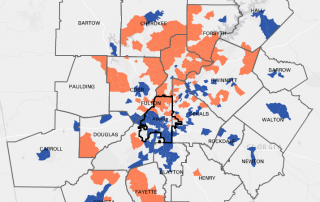
Using new U.S. Census Bureau data (2011-2015 American Community Survey via Neighborhood Nexus), this map shows the top 20% of neighborhoods with the highest median household incomes (orange) and the 20% with the lowest median household incomes (blue). The areas with the highest median incomes have a household income ranging from $81,250 to $178,438. [...]
As part of the Community Reinvestment Act, data is collected from banks and other lending institutions of a certain size to track where their loans are going (loans reported are for less than $1 million). When viewed spatially, this information can help give a snapshot of lending activity and assess how well local lending institutions are meeting [...]