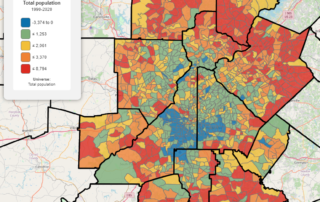
Fast-Growing Neighborhoods Over the Past 30 Years
Taking a closer look at thirty years of neighborhood population growth, decade by decade!

Taking a closer look at thirty years of neighborhood population growth, decade by decade!
Insights on demographic changes at the tract and city level, along with an interactive map allowing you to explore more.
We close our population decline series with a review of factors and an overview of recent Census Bureau estimates, along with the first-issued results of the 2020 Census, which appear to indicate that we are headed for at least a few years of slowing growth.
This next segment of our population decline series takes a look at death rates (total and age-adjusted) from 2000-2019, then reviews early indications for 2020 change.
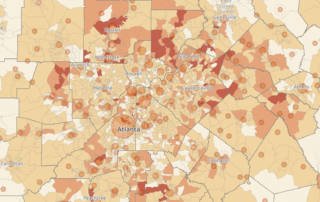
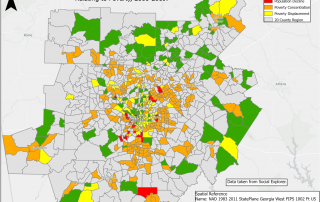
June's regional snapshot traces the socioeconomic and demographic change as reflected in and through two decades of census- tract level population shifts in the Atlanta Region. These meta-trends are clearly illustrative of increased race and class segregation across the area.
Population is still growing at a healthy clip in our area, but this growth was ebbing some even prior to the pandemic. We look at some ESRI data that indicates that, while fewer small areas are losing population 2010-2020 as compared to the last decade, fewer tracts are growing as quickly as they did during the 2000-2010 period. And overall, our region's growth rate has slowed 2010-2020.
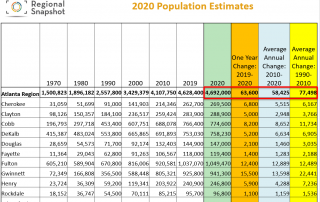
ARC's 2020 major jurisdiction population estimates. The 10-county region’s population increased by 1.2 percent and now stands at 4,692,000 — more than that of 24 states. A significant reduction in job growth has resulted in slowing of the region’s population growth, to the lowest level of the last four years.
What types of changes are Georgia and the Atlanta metro going through? We dipped into data from the Census Bureau's 2018 Population Estimates update for counties and metropolitan areas.