Regional Snapshot: Hispanic Heritage Month
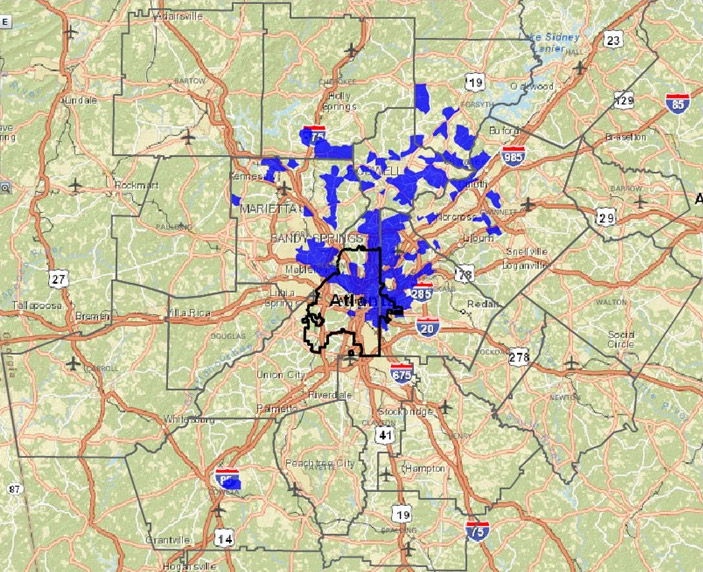
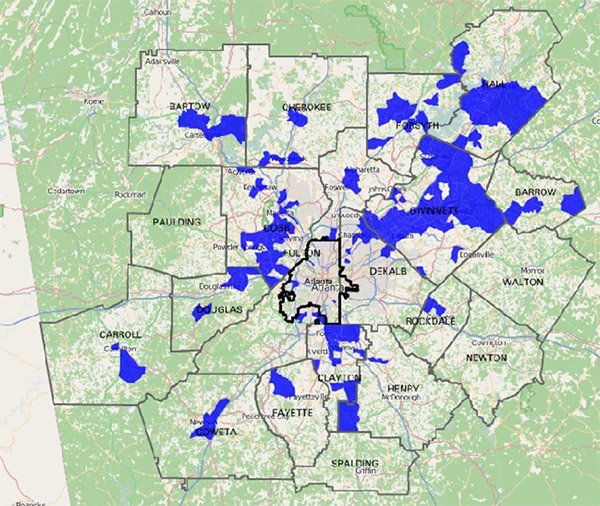
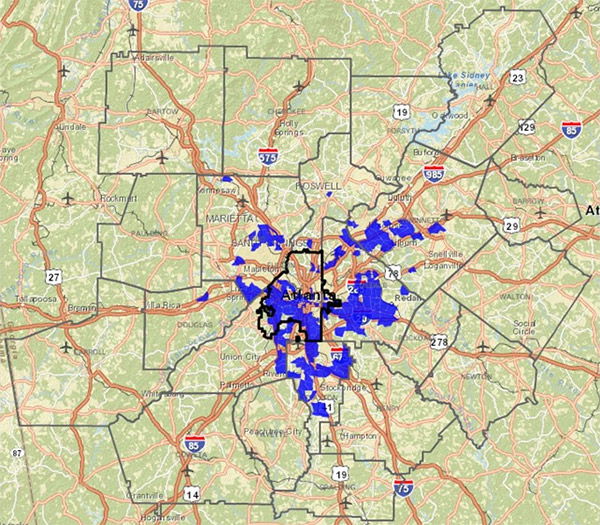
For October’s Regional Snapshot and in celebration of Hispanic Heritage Month (September 15th-October 15th), we have put together a profile on the Hispanic community in metro Atlanta! The highlights are: Although metro Atlanta has a smaller share of Hispanics than the other largest U.S. metros, it has the 2nd highest rate of employed Hispanics over [...]