
Monday Mapday
Maps showing themes and trends, published on Mondays

Monday Mapday: 2016 3rd Grade Reading Milestone Test
With the 2017 school year coming to an end, we take a look back at last year's Georgia Milestone scores for 3rd grade reading (English Language Arts). This map shows the mean scale scores [...]

Monday Mapday: MARTA usage after I-85 collapse
How has transit usage changed since the I-85 bridge collapse? The chart and map below use MARTA ridership data to show the change in average weekday ridership by rail station before and after the [...]

Monday Mapday: Change in Mortgage Loans, 2012 – 2015
The locations in dark blue had the greatest increase in the number of mortgage loans originated for buying homes per square mile from 2012 to 2015. The greatest increase in loans were concentrated in [...]

Monday Mapday: Linguistic Isolation
To measure linguistic isolation, the U.S. Census Bureau American Community Survey asks respondents how well they speak English. This map shows the top 20% of "neighborhoods" (census tracts are used to represent neighborhoods) that [...]

Monday Mapday: Connecting With Parks Storymap
As part of April's Regional Snapshot, the interactive storymap "Connecting With Parks - A Regional Perspective" combines maps, images, and text to tell stories about metro Atlanta's greenspace through five categories: “A River Runs [...]
Metro Atlanta Affordable Housing Tool
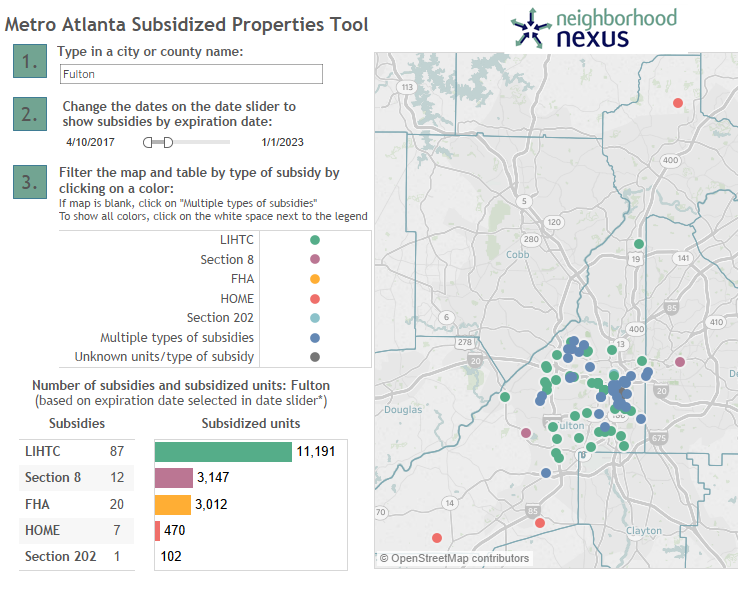
Contributing to the affordability problem in Metro Atlanta is the fact that a significant number of subsidized rental homes are coming to the end of their initial subsidy period. To aid in prioritizing affordable [...]