
Monday Mapday
Maps showing themes and trends, published on Mondays

Monday Mapday: Charitable Contributions
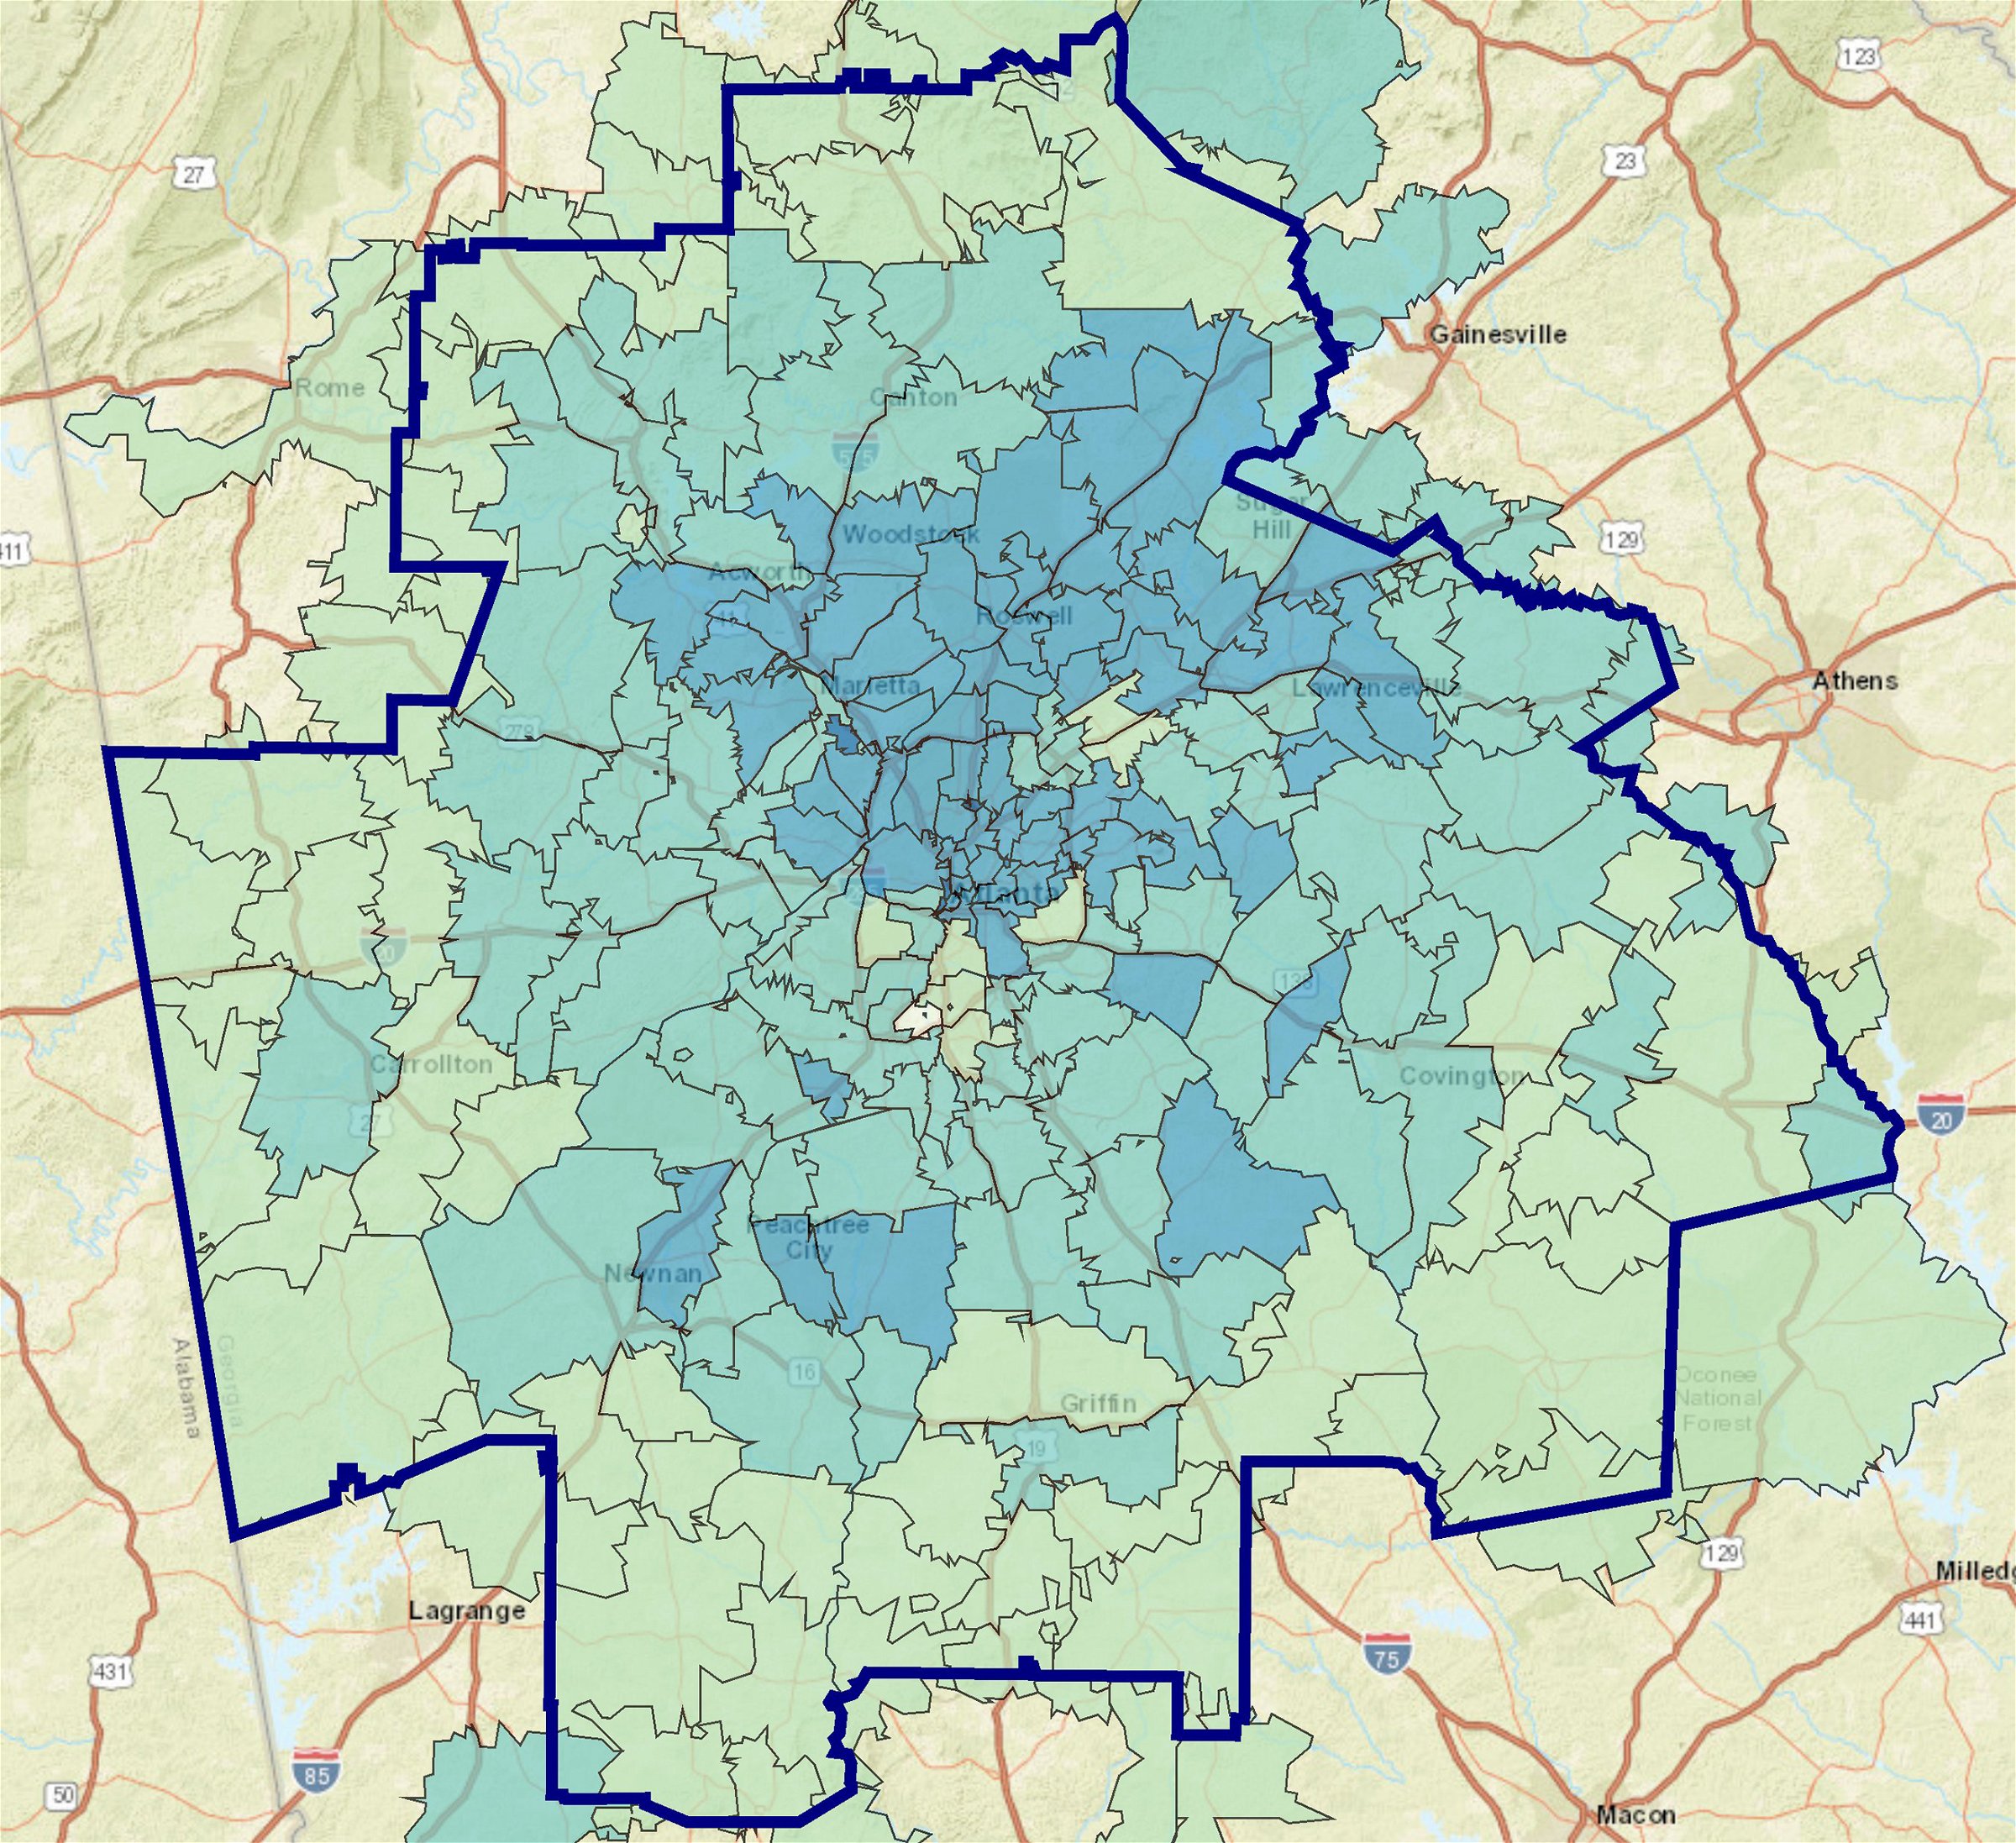
As the Southeast pulls together in the wake of Hurricane Irma, charitable giving is in the forefront of our minds at ARC. This week's Monday Mapday highlights charitable contributions by zip code in metro [...]
Monday Mapday: Time Spent Online
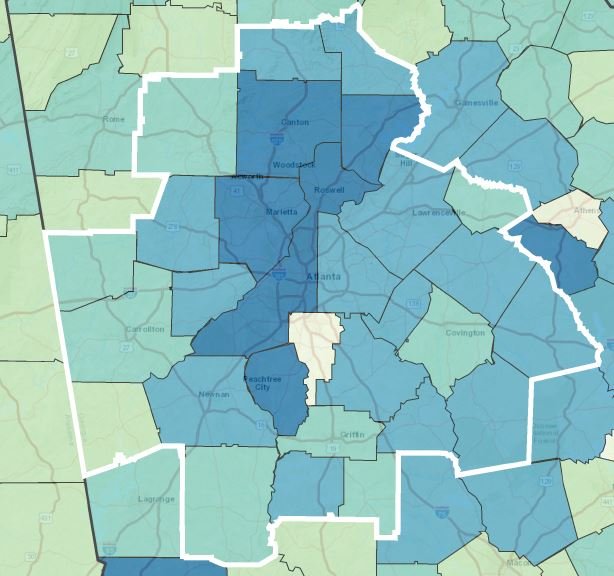
This week's Monday Mapday explores time spent online in the Atlanta metropolitan statistical area (MSA). The map below shows the percentage of the adults,* by zip code, that spent an average of 2 to [...]

Monday Mapday: Eclipse 2017 Path Across Georgia
DO NOT VIEW THE ECLIPSE WITHOUT SPECIAL "ECLIPSE GLASSES." CLICK HERE FOR DETAILS. A full solar eclipse will be visible across the continental United States today, with the best viewing in Georgia in the northeastern [...]

Monday Mapday: Home Sale Price Changes by Zip Code
When viewed at the zip code level, average home sale listing prices between 2012 and 2017 have increased everywhere across the 20-county Atlanta Metro Region*. The magnitude of increase, however, exhibits significant variation based [...]
Monday Mapday: Diversity in Metro Atlanta Region
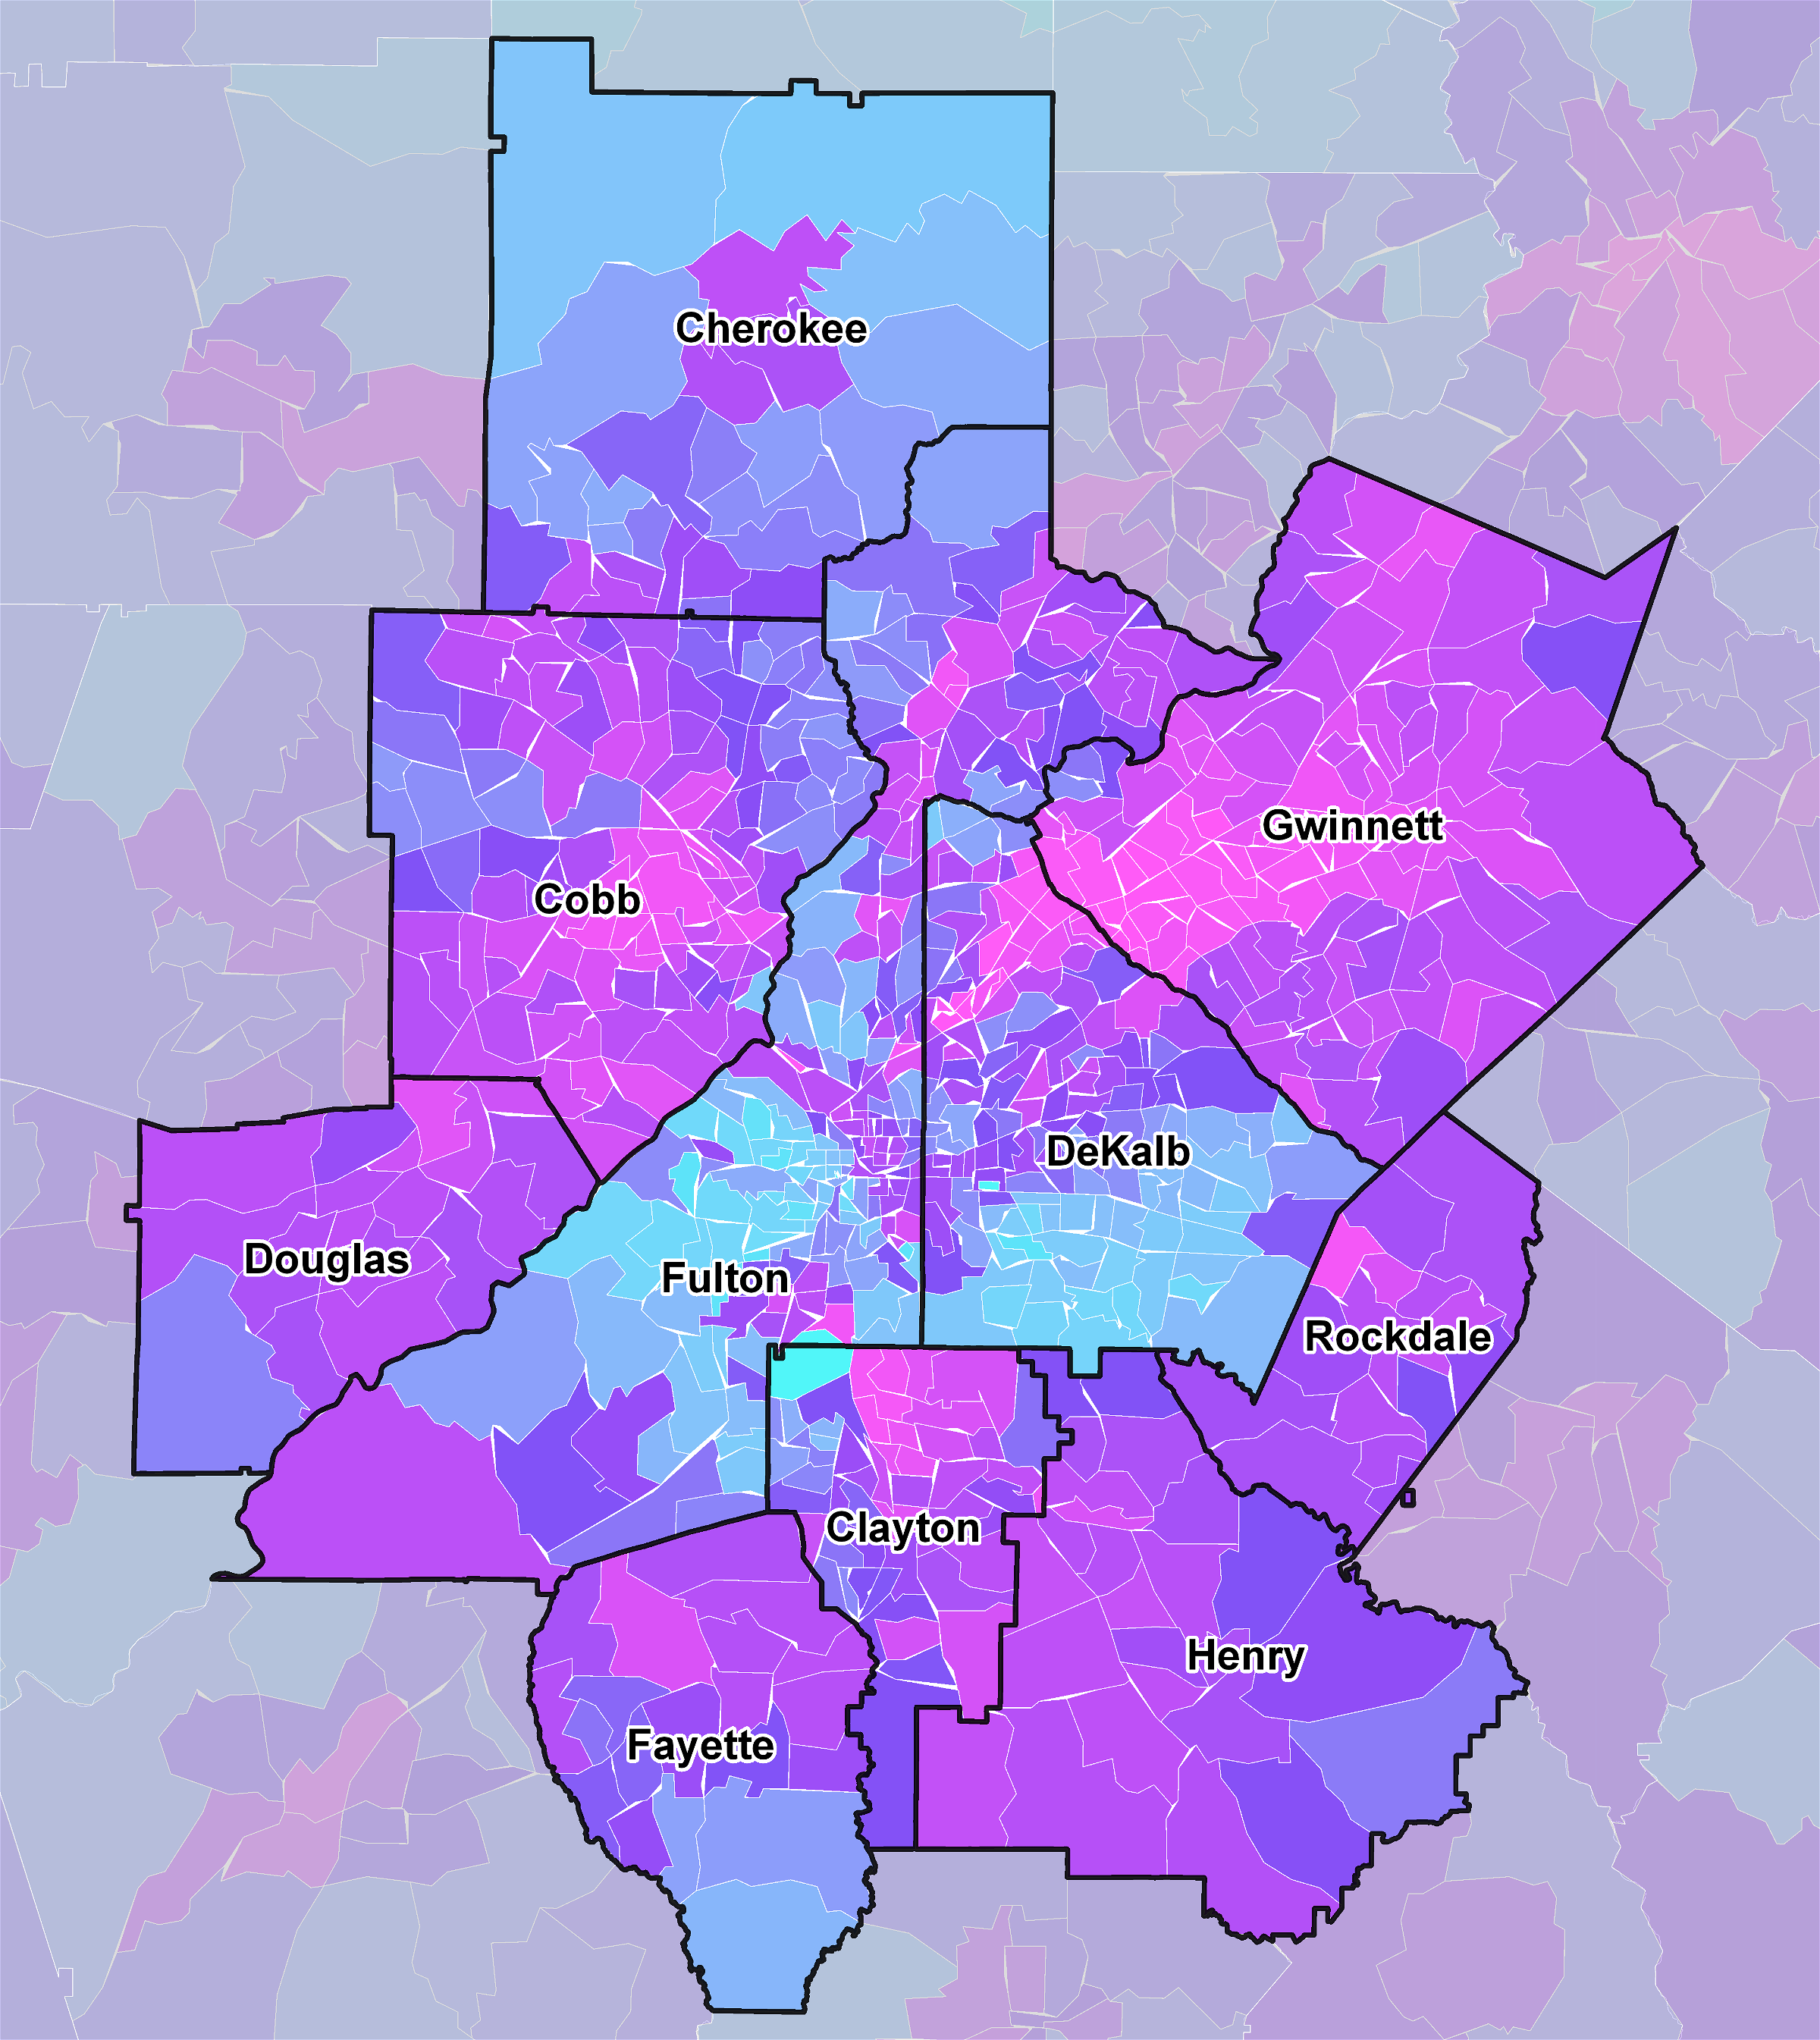
ESRI's diversity index provides an estimate of how likely two people, selected at random from the same geographic area, will belong to different racial or ethnic groups. Available down to the block group level, [...]
Monday Mapday: Regional Health Care Costs
This map shows average health care costs, by county, in the Atlanta metropolitan statistical area (MSA). Average health care costs include both health insurance and medical care costs. Areas shaded in dark blue (including [...]